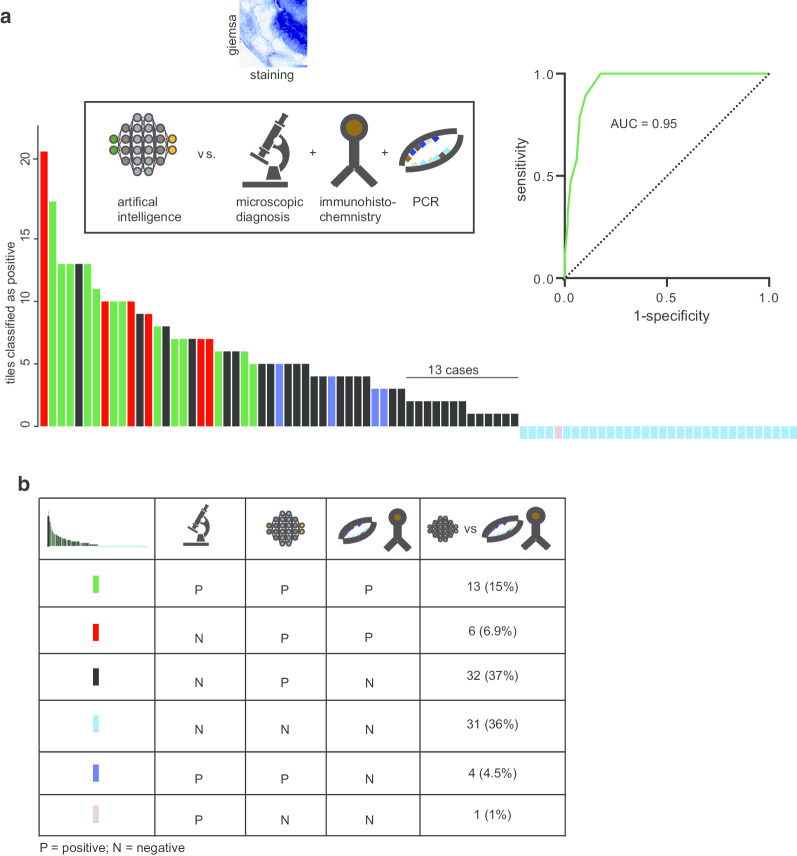
Fig. 4.
Validation of the decision support algorithm against microscopic diagnosis and IHC/PCR. a Bar chart of detection of H. pylori with help of the decision support algorithm, validated against microscopic diagnosis, and IHC/PCR using Giemsa stains. The Y-axis reflects the amounts of detected positive tiles using the algorithm. All 32 cases where the assistive approach did not detect H. pylori, underwent an additional PCR testing. The color code of each bar is shown in legend of (b). c Calculation of area-under-the-curve (AUC) of H. pylori detection for H&E stains validated against microscopic diagnosis

