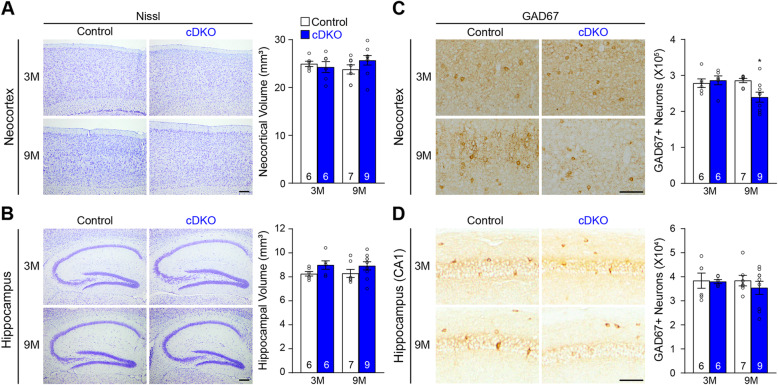
Fig. 3.
Progressive reduction of cortical interneurons in IN-PS cDKO mice. a Left: Nissl staining of comparable sagittal sections of IN-PS cDKO mice and littermate control brains at the ages of 3 and 9 months shows normal gross morphology in the neocortex of IN-PS cDKO mice. Right: Stereological quantification shows similar volume of the neocortex between IN-PS cDKO and control mice at 3 and 9 months of age (F1, 24 = 1.74, p = 0.20; 3 M: p > 0.99, 9 M: p = 0.31, two-way ANOVA with Bonferroni’s post hoc comparisons). b Left: Nissl staining of comparable sagittal sections of IN-PS cDKO mice and littermate control brains at the age of 3 and 9 months shows normal gross morphology in the hippocampus of IN-PS cDKO mice. Right: Stereological quantification shows similar volume of the hippocampus between IN-PS cDKO and control mice at 3 and 9 months of age (F1, 24 = 0.02, p = 0.88; 3 M: p = 0.31, 9 M: p = 0.32, two-way ANOVA with Bonferroni’s post hoc comparisons). c Left: GAD67 immunostaining of comparable sagittal sections in the neocortex of IN-PS cDKO and littermate control brains at 3 and 9 months of age. Right: Stereological quantification shows age-dependent decreases in the number of GAD67-immunoreactive interneurons in the neocortex of IN-PS cDKO mice compared to that in control mice (F1, 24 = 4.89, p = 0.0368; 3 M: Control 2.79 ± 0.12 × 10⁵, cDKO 2.86 ± 0.12 × 10⁵, p > 0.99, 9 M: Control 2.86 ± 0.06 × 10⁵, cDKO 2.40 ± 0.14 × 10⁵, p = 0.0167, two-way ANOVA with Bonferroni’s post hoc comparisons). d Left: GAD67 immunostaining of comparable sagittal sections in hippocampal area CA1 of IN-PS cDKO and littermate control brains at 3 and 9 months of age. Right: Stereological quantification shows no significant decrease in the total number of GAD67-immunoreactive interneurons in the entire hippocampus of IN-PS cDKO mice compared to that in control mice (F1, 24 = 0.26, p = 0.61; 3 M: Control 3.84 ± 0.32 × 10⁴, cDKO 3.80 ± 0.08 × 10⁴, p > 0.99; 9 M: Control 3.84 ± 0.22 × 10⁴, cDKO 3.54 ± 0.28 × 10⁴, p = 0.75, two-way ANOVA with Bonferroni’s post hoc comparisons). Scale bar: 100 μm. All data represent mean ± SEM. *p < 0.05. The value in the column indicates the number of mice used in each experiment

