Fig. 9.
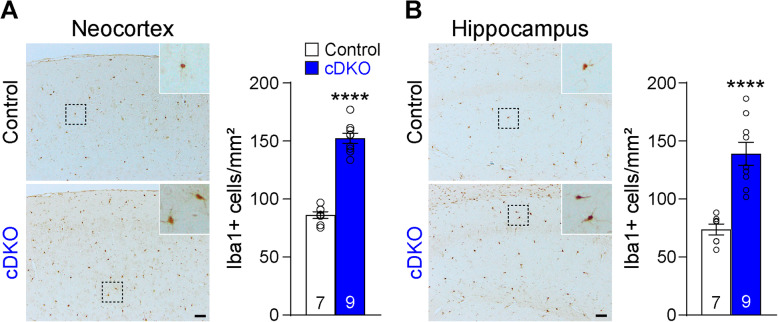
Microgliosis in the cerebral cortex of IN-PS cDKO mice. a Left: Iba1 immunostaining of comparable sagittal sections in the neocortex of IN-PS cDKO and littermate control brains at 9 months of age. Inserts show higher power views of the boxed areas. Right: Stereological quantification shows significant age-dependent increases in the number of Iba1-immunoreactive cells in the neocortex of IN-PS cDKO mice relative to control mice (Control: 86.17 ± 2.90 cells/mm2, cDKO: 152.40 ± 4.34 cells/mm2, p < 0.0001, Student’s t-test). b Left: Iba1 immunostaining of comparable sagittal sections in the hippocampus of IN-PS cDKO and littermate control brains at 9 months of age. Inserts show higher power views of the boxed areas. Right: Stereological quantification shows significant age-dependent increases in the number of Iba1-immunoreactive cells in the neocortex of IN-PS cDKO mice relative to control mice (Control: 73.70 ± 4.64 cells/mm2, cDKO: 139.00 ± 9.97 cells/mm2, p < 0.0001, Student’s t-test). Scale bar: 100 μm. All data represent mean ± SEM. **** p < 0.0001. The value in the column indicates the number of mice used in each experiment

