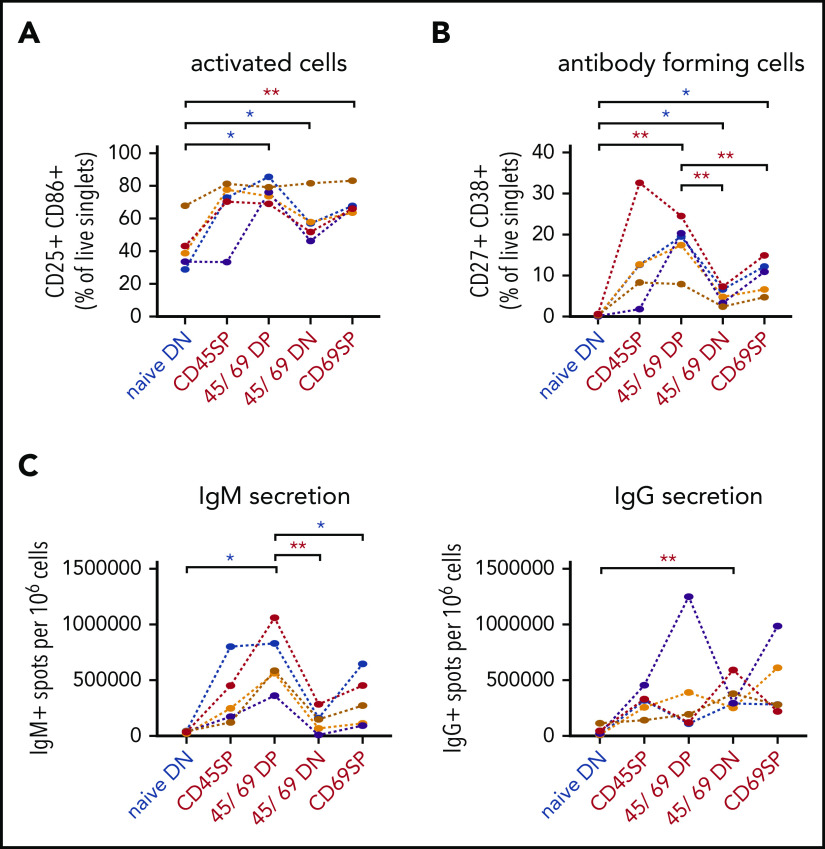
Figure 5.
Functional characterization of splenic CD45RB/CD69 MBC subsets. Splenocytes of indicated phenotype of NBCs (blue) and MBCs (red) were sort-purified and cultured for 5 days in the presence of ODN2006. (A) After 5 days of stimulation, cells were harvested, and activation markers CD25 and CD86 were analyzed by using flow cytometry. (B) Cells were subjected to flow cytometric analysis to measure AFC (CD27+ CD38+ of live singlets) frequencies. (C) Graphs show the AFC response measured by Enzyme-Linked ImmunoSpot assay for IgM (left panel) and IgG (right panel) isotype for the different subsets. D315 (blue), D443 (orange), D424 (purple), D269 (mustard), and D462 (red); P values for multiple comparisons were adjusted by using a Bonferroni correction (**q < 0.05; *0.05 ≤ q < 0.15).

