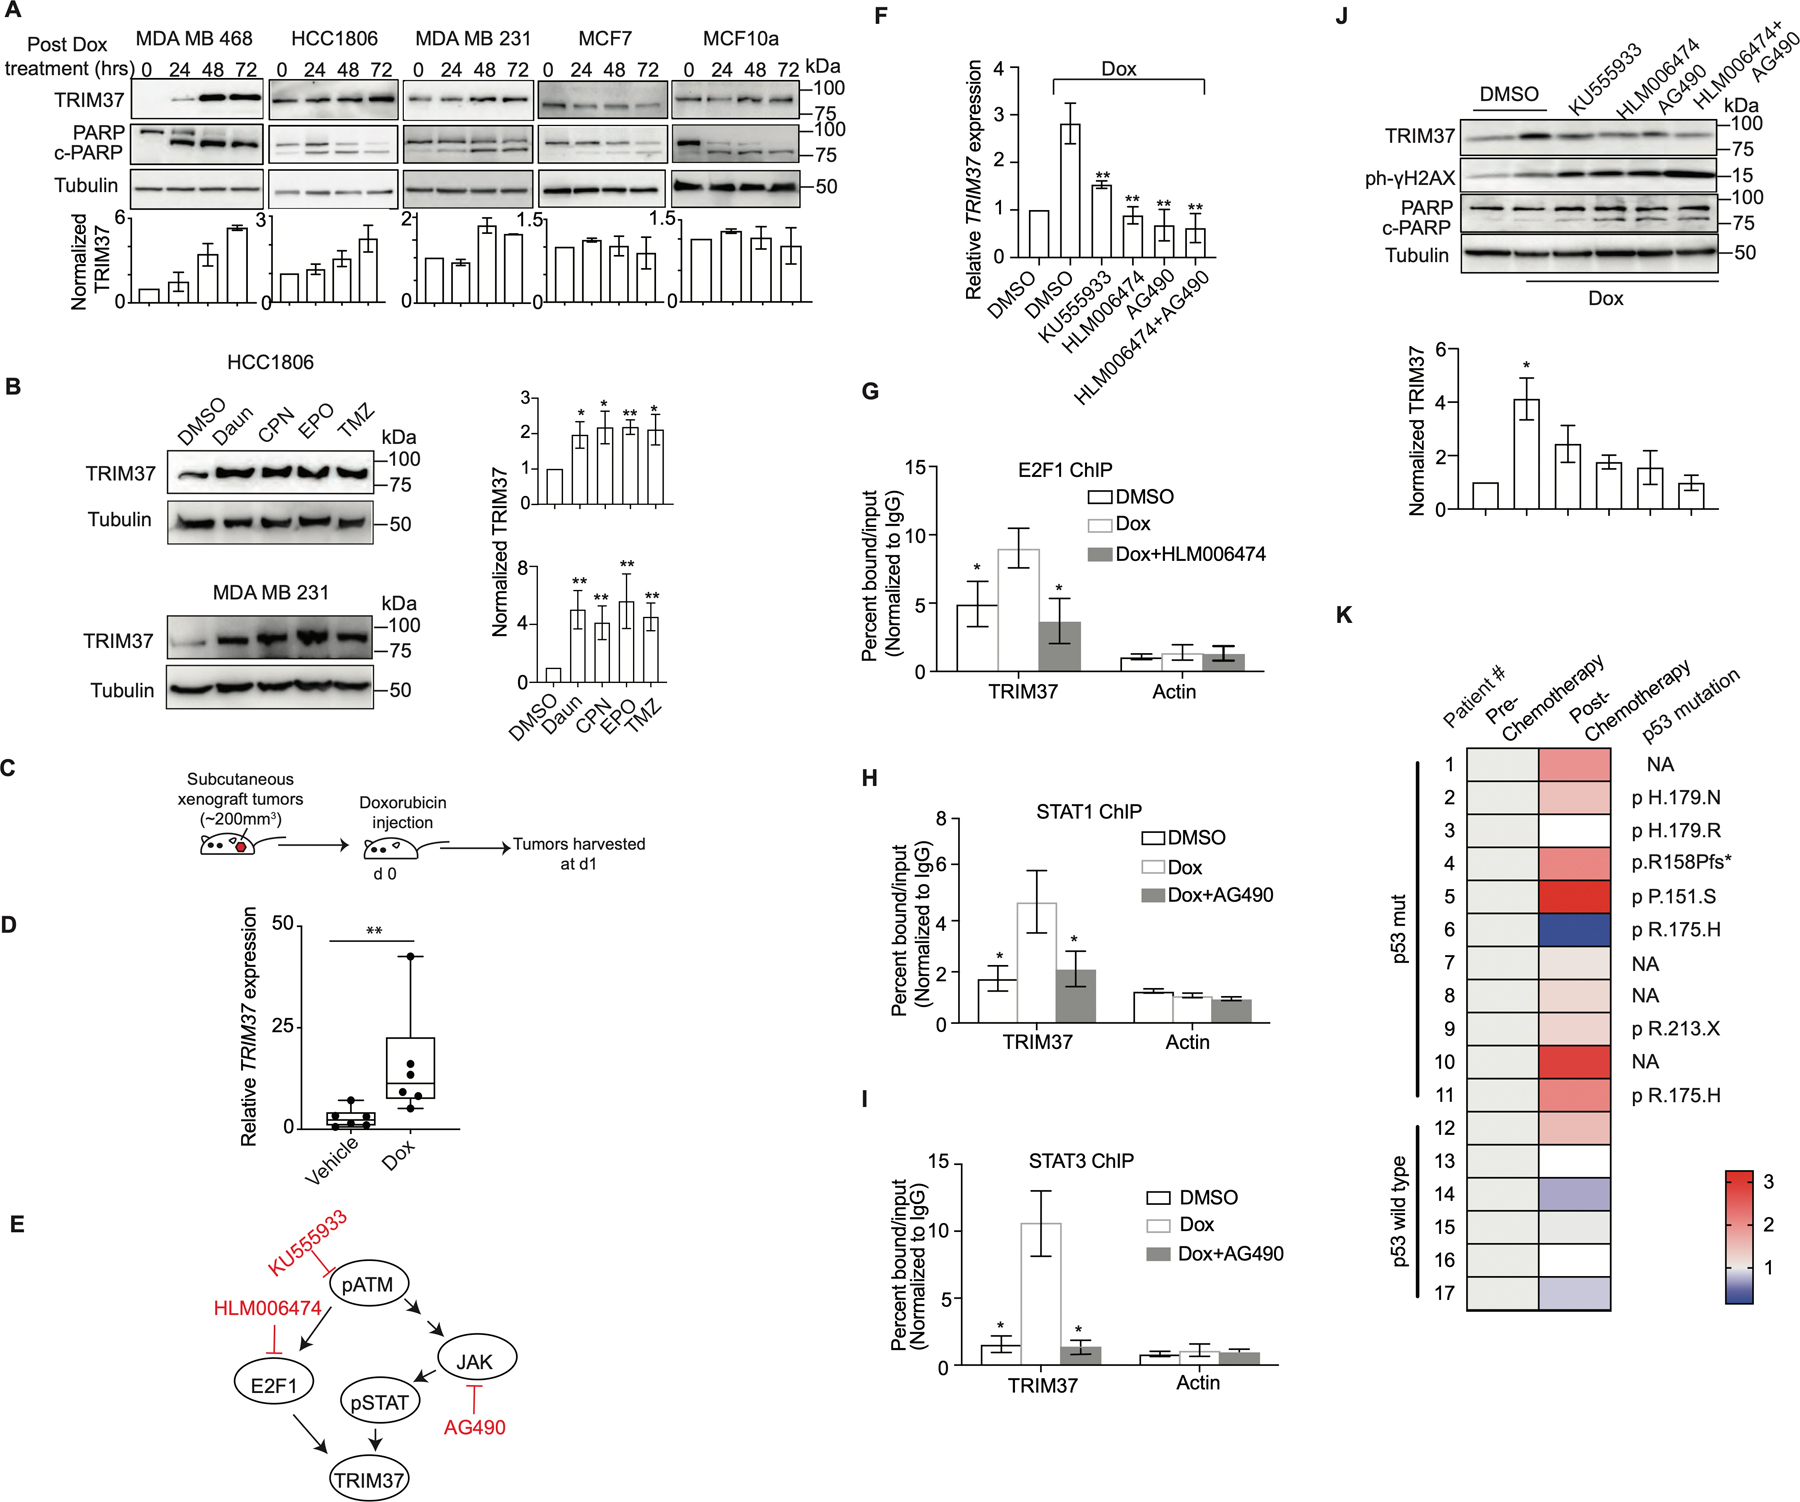
Figure. 4. Chemotherapy amplifies oncogenic TRIM37 network in TNBC.

(A) Top, Immunoblots in MDA MB 468, HCC1806, MDA MB 231, MCF7, and MCF10A cells treated with Dox for 0, 24, 48 and 72 hrs. Tubulin is the loading control. Bottom, Quantification of TRIM37 relative to Tubulin. (B) Immunoblot monitoring TRIM37 in HCC1806 (Top) or MDA MB 231 (Bottom) cells treated with daunorubicin (Daun), cisplatin (CPN), etoposide (EPO) or temozolomide (TMZ). Tubulin is the loading control. Right, Quantification of TRIM37 relative to Tubulin. (C) Schematic showing that NSG mice were treated with intraperitoneal injection of 2 mg/kg Dox once tumor reached the size of ~200 mm3. Tumors were harvested postmortem. (D) qRT-PCR monitoring TRIM37 expression in HCC1806 subcutaneous tumors-derived from NSG mice following treatment with Dox. n=6 animals per group. (E) Schematic of ATM signaling with the downstream effectors of ATM, E2F1, and STAT. Specific small molecule inhibitors of the ATM signaling are also indicated (Red). (F) qRT-PCR monitoring TRIM37 expression in MDA MB 468 cells following treatment with KU555933, HLM006474 or AG490 in combination with Dox. (G-I) ChIP analysis monitoring the binding of E2F1 (G), STAT1 (H), and STAT3 (I) to TRIM37 and Actin in MDA MB 468 cells treated with HLM006474 or AG490 in combination with Dox. (J) Top, Immunoblots in MDA MB 468 cells treated with Dox and the indicated inhibitors of ATM signaling. Tubulin is the loading control. Bottom, Quantification of TRIM37 relative to Tubulin. (K) Heat map for TRIM37 expression in mutant and wild type TP53 TNBC tumor tissue samples pre- and post-chemotherapy. The type of TP53 mutation is indicated on the right. NA, not available. (n = 17). Error bars indicate standard deviation and range of at least three biological replicates. * p<0.05; ** p<0.01; ***p<0.001.
