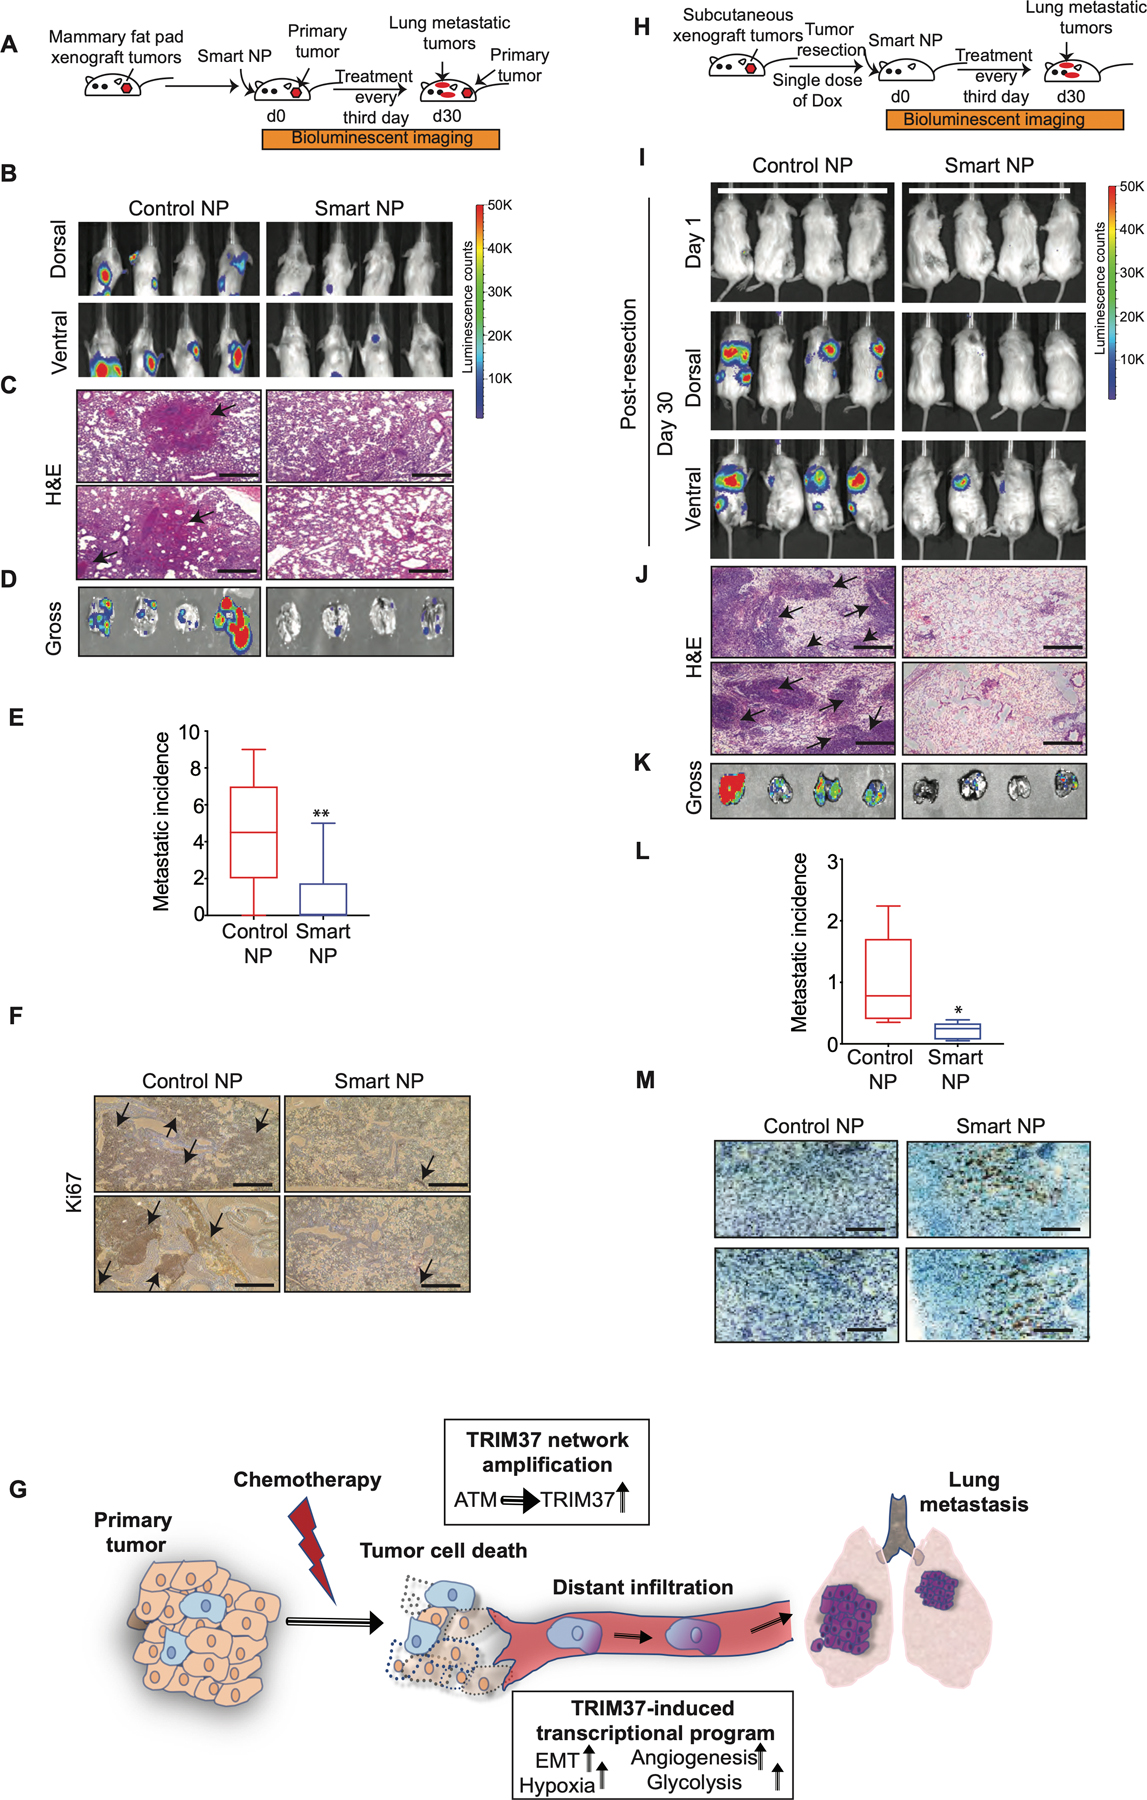
Figure 7. Targeting of TRIM37 suppresses metastatic lung tumors in vivo.

(A) Schematic showing that female Balb/c mice bearing mammary fat pad 4T1 tumors were treated with intranasal and intratumor injections of smart or control nanoparticles. n=8 animals per group. (B) Representative dorsal and ventral BLI images of tumor bearing mice at day 30 after treatment with either control or smart nanoparticles. The color scale depicts the luminescence counts emitted from the metastasis cells. n=4 animals per group. (C) Representative 10X H&E staining images of the lung metastases for control and smart nanoparticle treated animals. Scale bar, 0.5 mm. Arrows indicate lung metastatic nodules. (D) Lung necropsies from animals in (B) were analyzed by fluorescent imaging for tumor burden. (E) Quantification of metastasis incidence in the lung tissue after control or smart nanoparticles treatment. n=8 animals per group. (F) Ki67 staining of lung tumors derived from mice treated with control or smart nanoparticles. Scale bar, 0.5 mm. Arrows indicate highly proliferative lung metastatic nodules. (G) Model depicting TRIM37 function in multiple steps of TNBC metastasis. (H) Schematic showing that NSG mice bearing subcutaneous 231-2b tumors were treated with intranasal injections of smart or control nanoparticles in combination with Dox post-tumor resection. n=8 animals per group. (I) Representative BLI images for tumor-bearing mice at day 1 and day 30 post-primary tumor resection. The color scale depicts the luminescence counts emitted from the metastasis cells. n=4 animals per group. (J) Representative 10X H&E staining images of the lung sections of control and smart nanoparticle treated animals. Scale bar, 0.5 mm. Arrows indicate lung metastatic nodules. (K) Lung necropsies from animals in (I) were analyzed for tumor burden. (L) Quantification of accumulated luciferase signal from the lung tissue after control and smart nanoparticles treatment. n=8 animals per group. (M) Caspase 3 staining of lung tumors derived from mice treated with control or smart nanoparticles in combination with Dox. Scale bar, 0.5 mm. Error bars indicate standard deviation and range of at least three biological replicates. * p<0.05; ** p<0.01; *** p<0.001.
