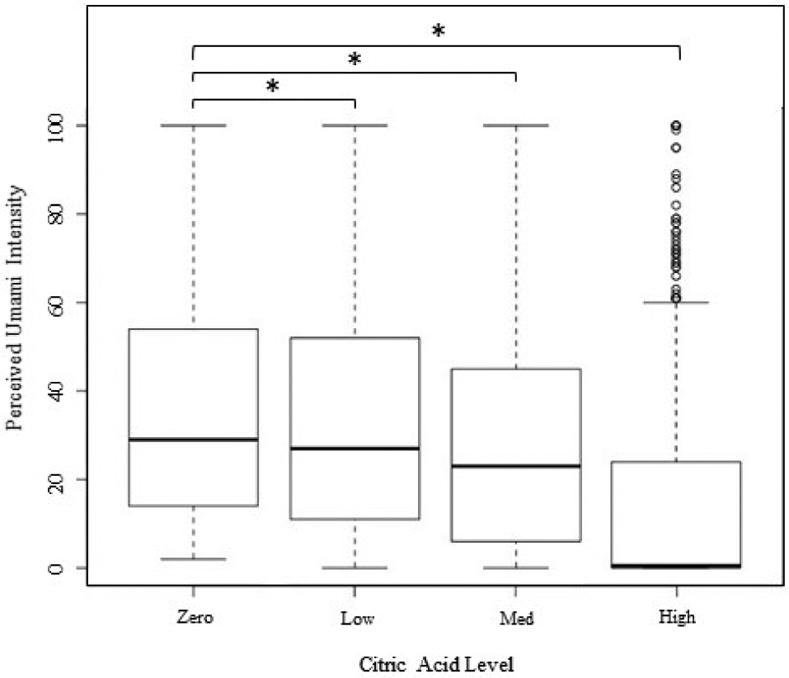
Figure 1.

Boxplot of umami strength at varying citric acid levels. Zero citric acid was used as the baseline level. As the concentration of citric acid increases, the perceived strength of umami decreases. * indicates significant difference (p < 0.05) from baseline.
