
Figure 2.
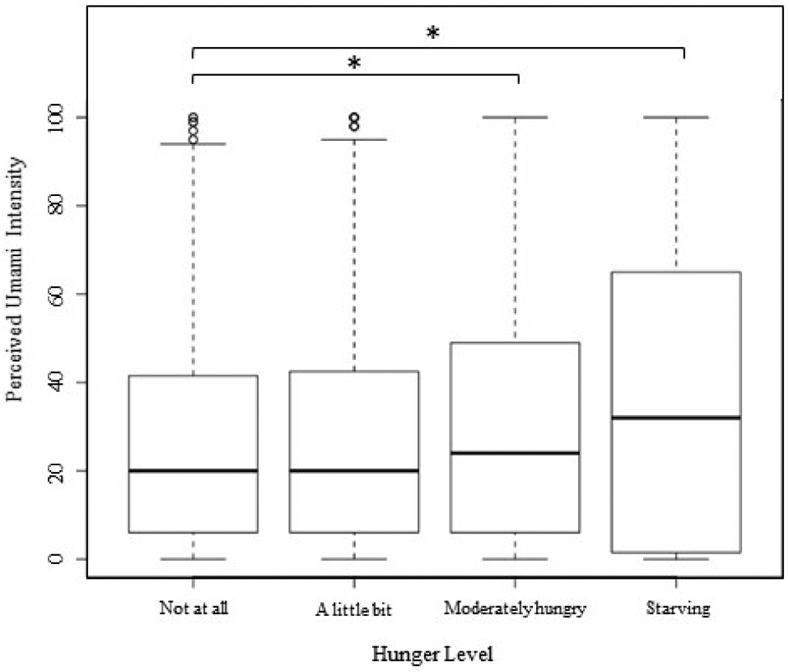
Boxplot of umami strength at differing hunger levels. Not at all hungry was used as the baseline. As the degree of hunger increases, the perceived umami strength also increases. * indicates significant difference (p < 0.05) from baseline.
Official websites use .gov
A
.gov website belongs to an official
government organization in the United States.
Secure .gov websites use HTTPS
A lock (
) or https:// means you've safely
connected to the .gov website. Share sensitive
information only on official, secure websites.
Boxplot of umami strength at differing hunger levels. Not at all hungry was used as the baseline. As the degree of hunger increases, the perceived umami strength also increases. * indicates significant difference (p < 0.05) from baseline.