
Figure 2.
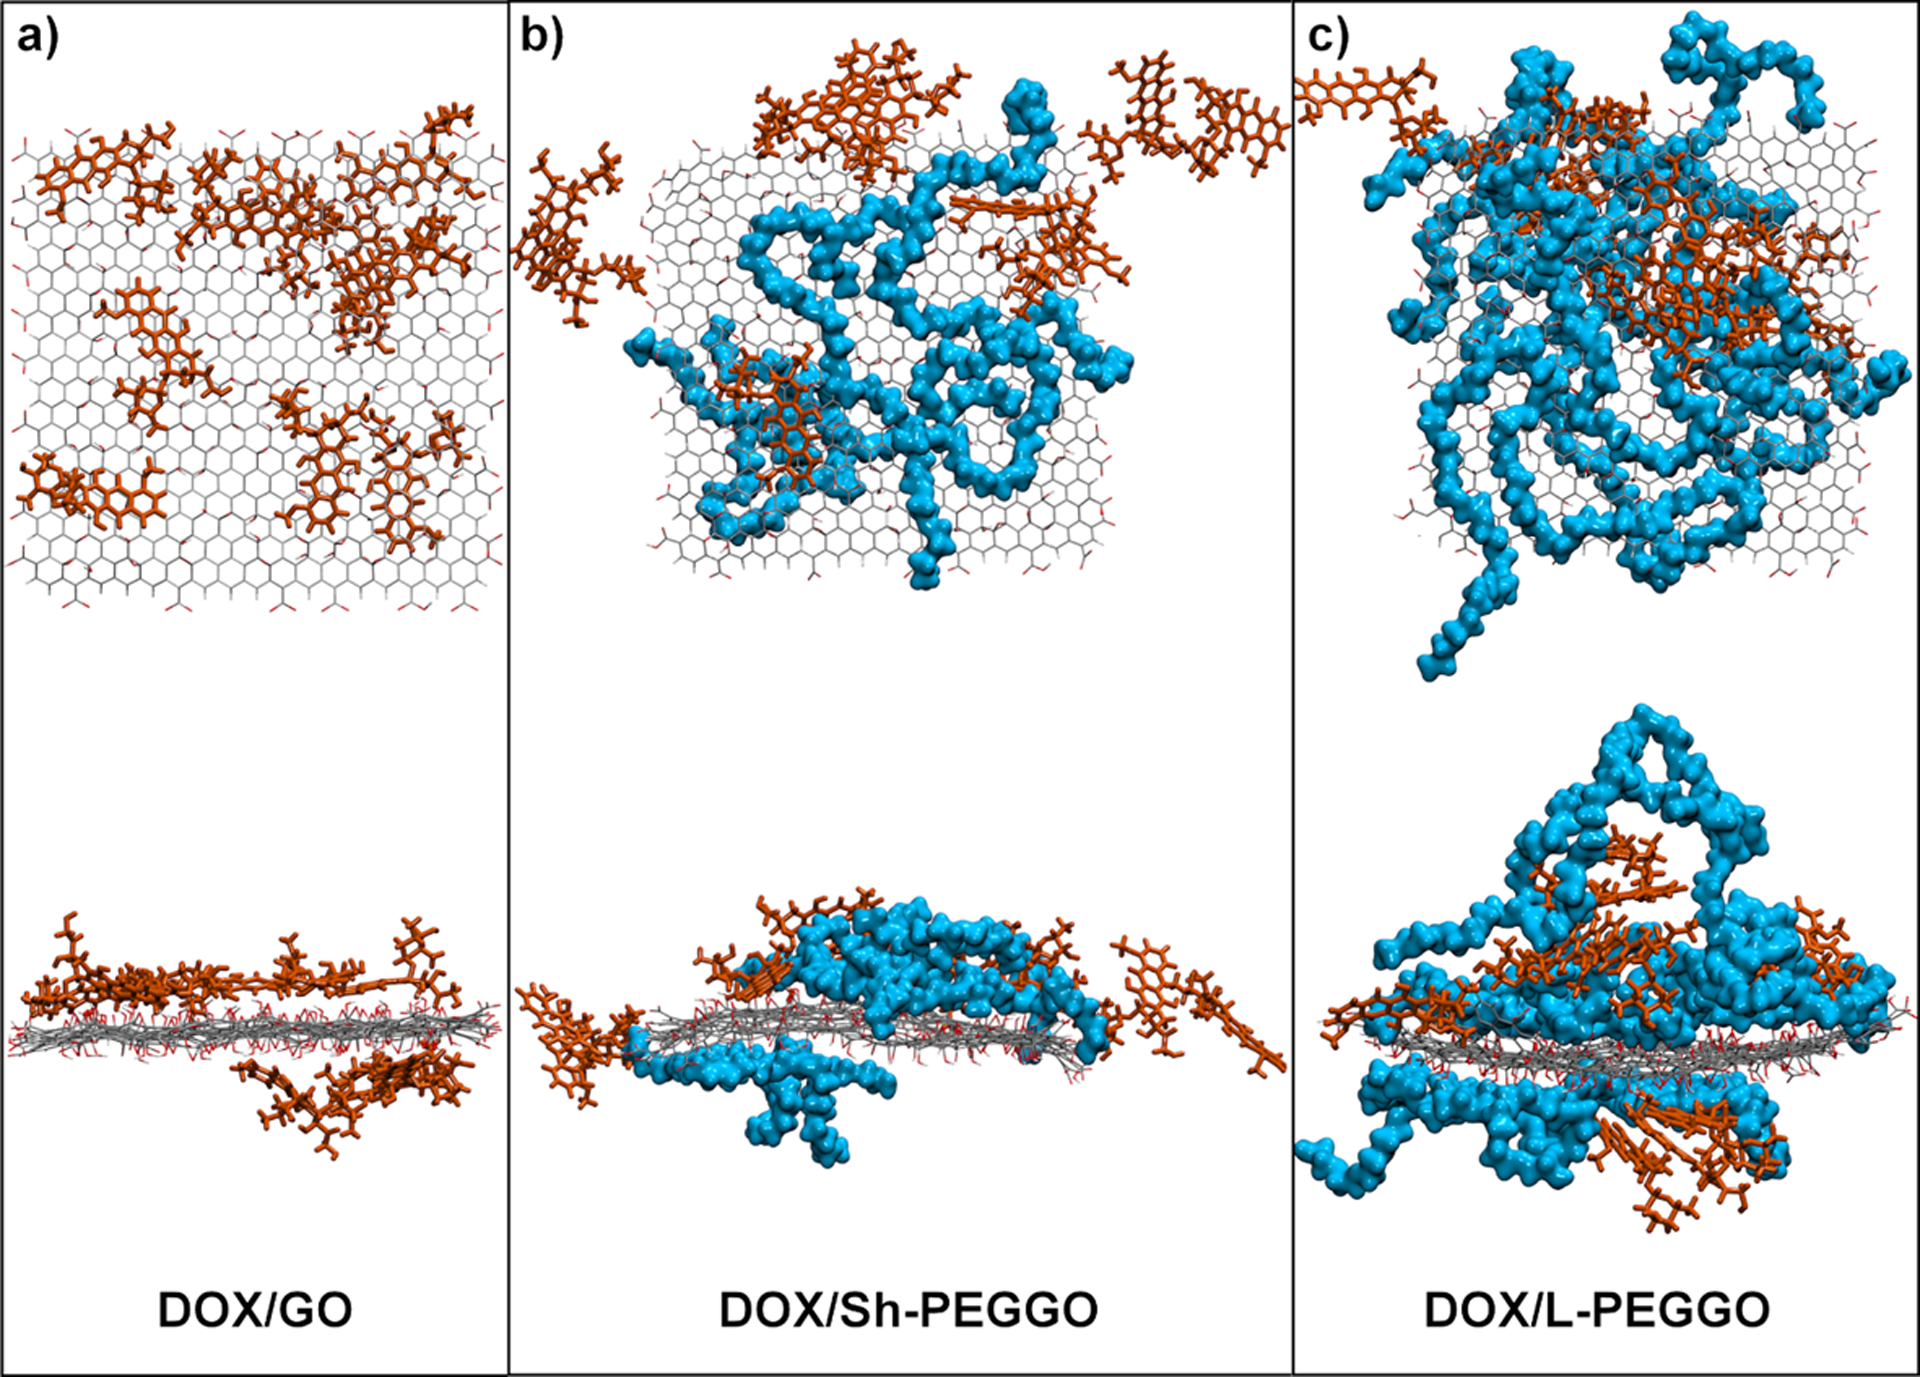
Representative final configurations of a) DOX/GO, b) DOX/Sh-PEGGO, and c) DOX/L-PEGGO after 30 ns of simulation. Top and bottom panels show top and side views of the systems. The DOX molecules are drawn as brown sticks, while the PEG chains are drawn as blue spheres. The GO sheet (thin lines) is drawn with carbon and oxygen atoms in gray and red, respectively. For clarity, the water molecules are excluded from the illustrations.