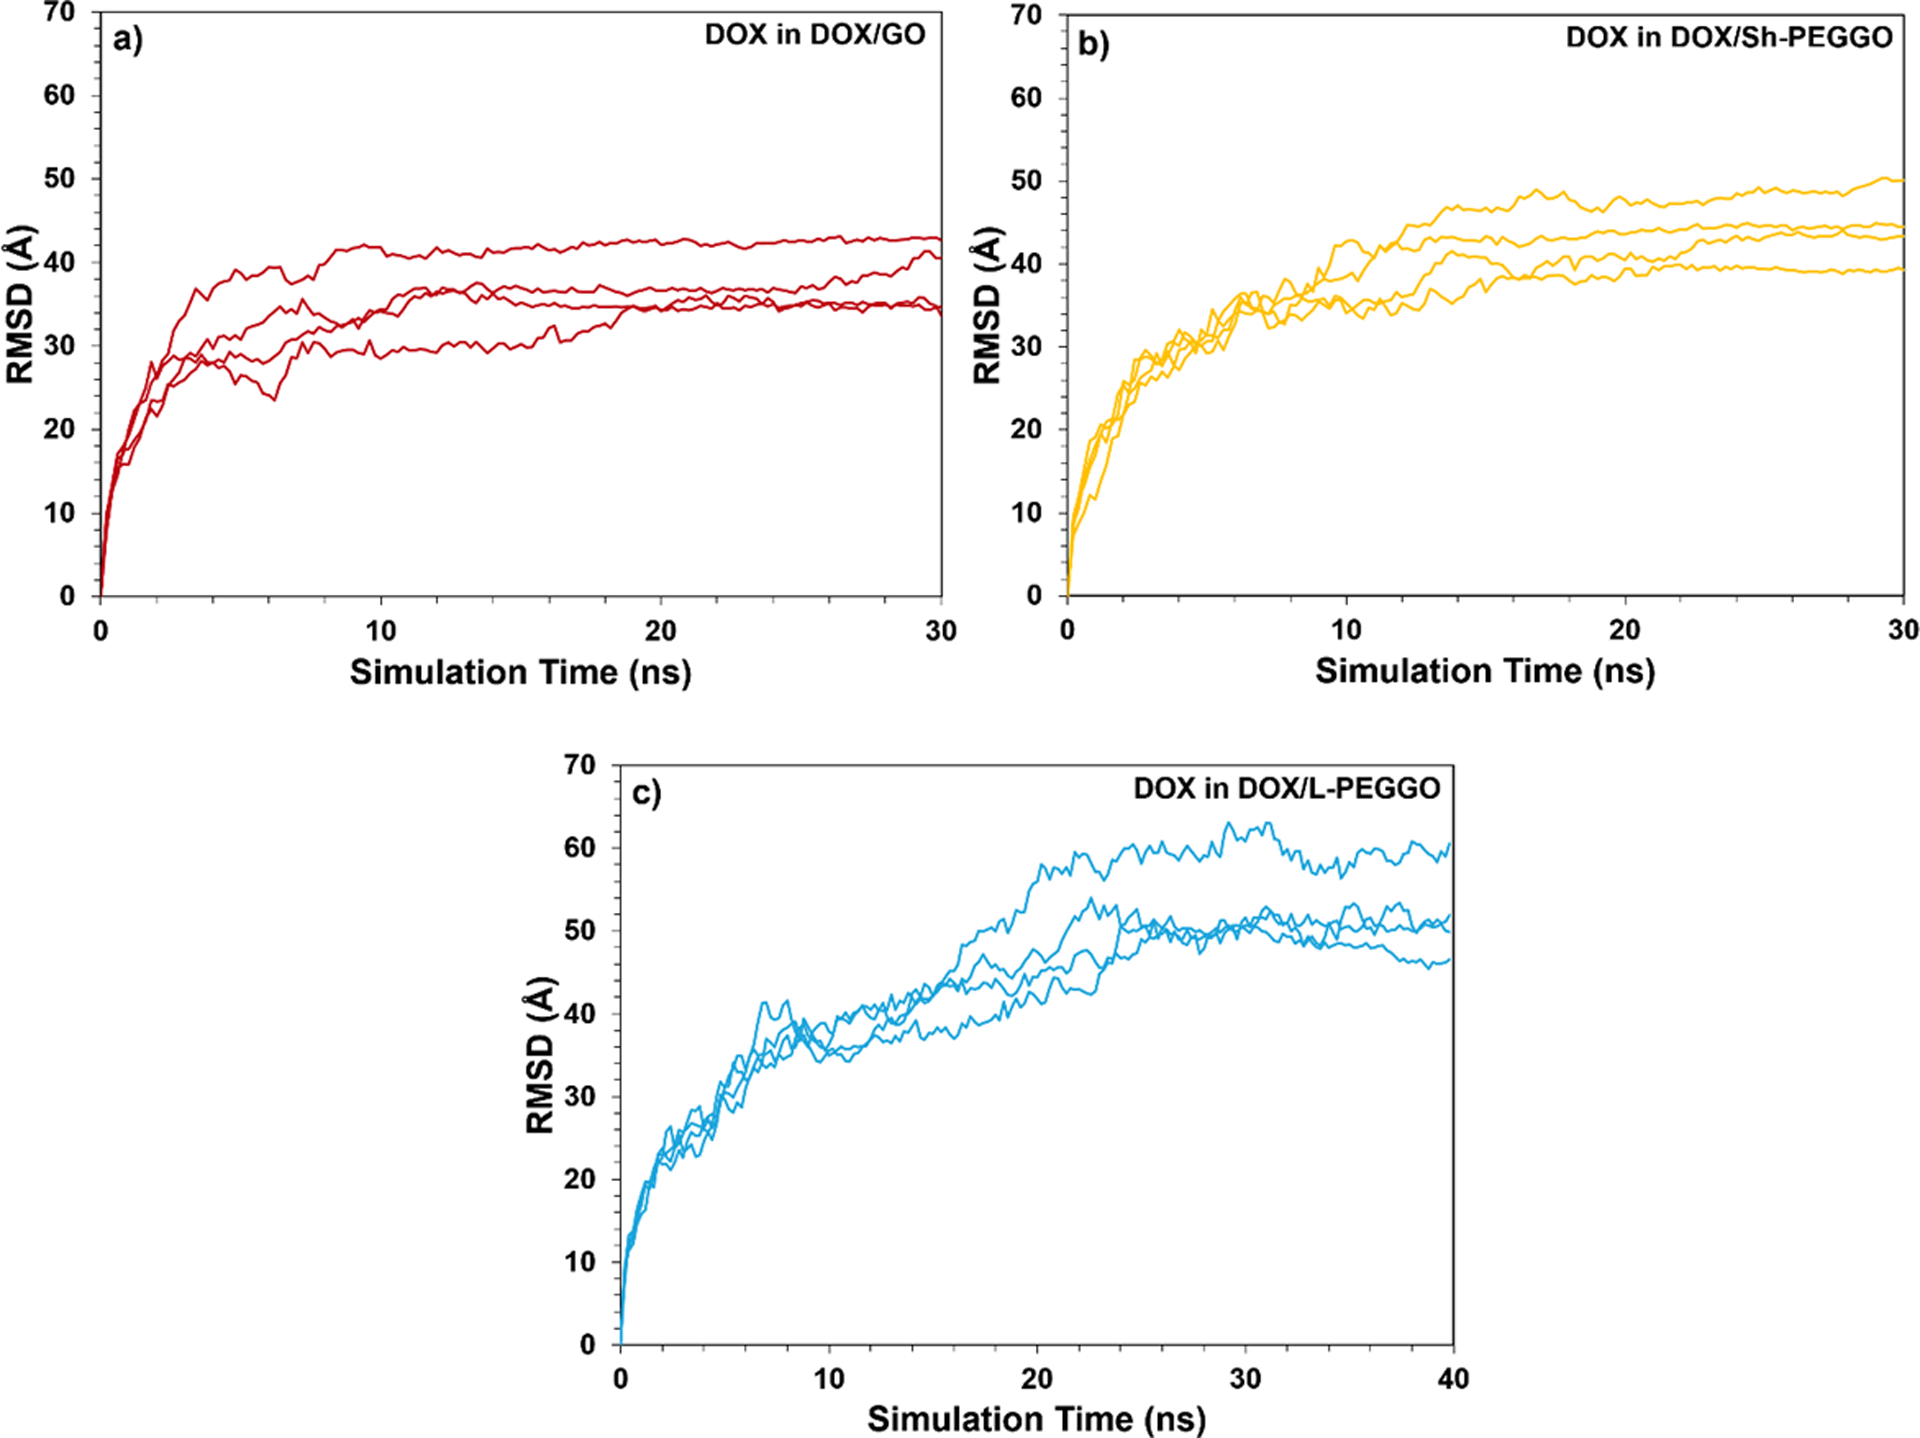
Figure 5.

Root-mean square deviation (RMSD) of the 10 DOX molecular positions (treated as an assembly) from the GO surface as a function of simulation time in a) DOX/GO, b) DOX/Sh-PEGGO, and c) DOX/L-PEGGO systems. The RMSD plots for each of the four replicates are shown. The total simulation time for the DOX/L-PEGGO system was 40 ns.
