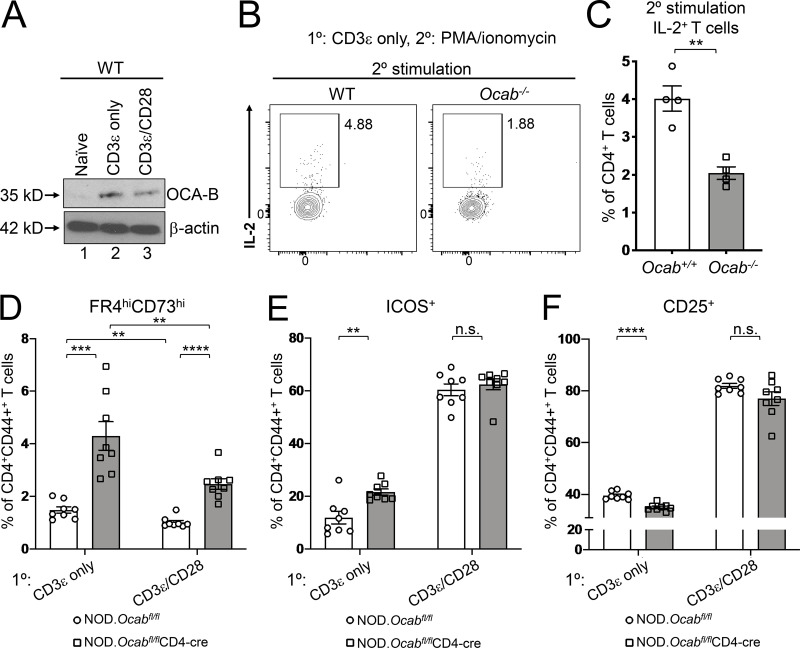
Figure 5.
OCA-B loss in CD4+ T cells increases anergy in vitro. (A) Naive CD4+ C57BL/6 T cells were stimulated in vitro for 24 h with anti-CD3ε antibodies ± costimulation with CD28 antibodies. Lysates were prepared and subjected to immunoblotting using OCA-B antibodies. β-Actin is shown as a loading control. (B) Naive OCA-B–deficient and control CD4+ T cells were stimulated in vitro with anti-CD3ε antibodies. 48 h later, the cells were restimulated with PMA and ionomycin for 6 h in the presence of brefeldin A, stained for intracellular IL-2, and analyzed by flow cytometry. Cells were gated on CD4 and CD44. (C) Quantitation using independently purified cells from the spleens of four mice treated similar to those in B. Student’s t test P value = 0.0019. (D) Naive OCA-B–deficient and littermate control splenic CD4+ T cells from 6-wk-old NOD mice were stimulated for 2 d in vitro with indicated antibodies, replated, and rested in the absence of antibody for 2 d, and analyzed by flow cytometry. Mean FR4hi CD73hiCD4+CD44+ cell frequencies are shown using independently purified cells from the spleens of two mice, with four independent culture replicates performed for each mouse (n = 8). Student’s t test P values: CD3ε only, 0.0002; CD3ε/CD28, 1.04 × 10⁻⁵; control CD3ε vs. CD3ε/CD28, 0.0053; OCA-B–deficient CD3ε vs. CD3ε/CD28, 0.0068. (E) Similar to D, except frequencies of CD4+CD44+ICOS+ cells are plotted. CD3ε-only Student’s t test P value = 0.0026. (F) Similar to D, except average percentages of CD4+CD44+CD25+ cells are plotted. CD3ε-only Student’s t test P value = 1.80 × 10⁻⁵. All error bars denote ±SEM. **, P ≤ 0.01; ***, P ≤ 0.001; ****, P ≤ 0.0001. n.s., not significant.

