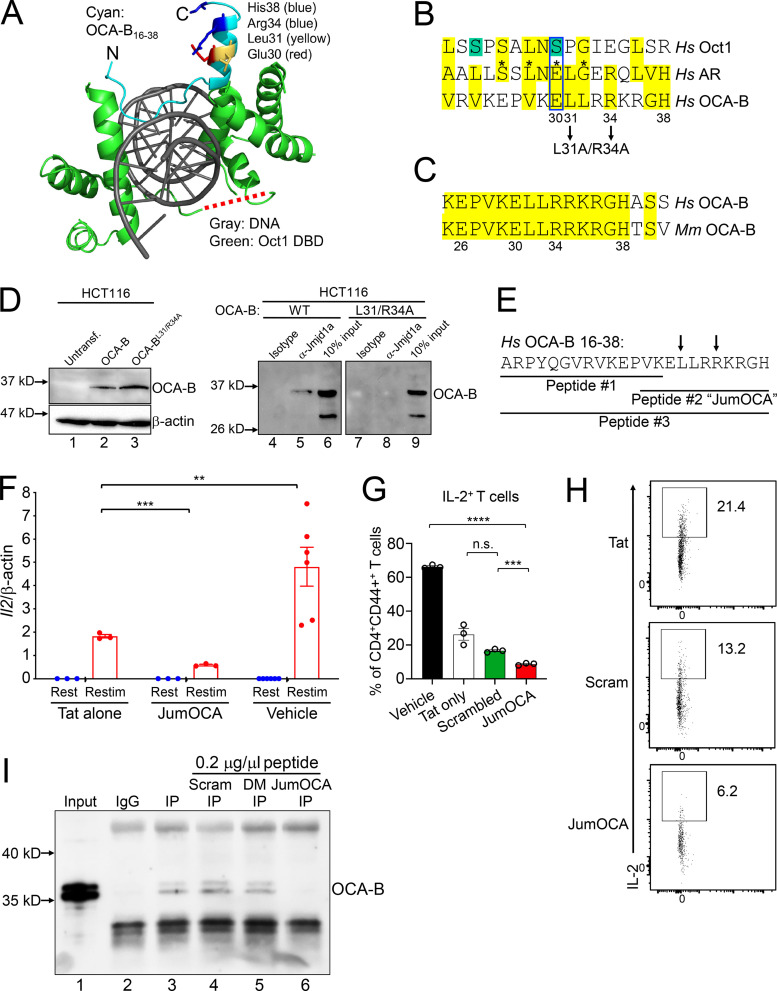
Figure 6.
Design and validation of OCA-B peptide inhibitors. (A) OCA-B N terminus (residues 16 and 38)/Oct1 DNA binding domain/octamer binding DNA cocrystal structure (Protein Data Bank identification 1CQT; Green, 2016). Gray: DNA. Green: Oct1 DNA binding domain. Cyan: OCA-B. Red dashed line shows position of the Oct1 linker domain. N, number. DBD, DNA binding domain. Untransf., untransfected. (B) Top alignment of the human AR isoform transcript variant 1 (sequence identification ADD26780.1) coactivator interaction domain (residues 698–721) with full-length human Oct1 and OCA-B. The aligned regions are from the Oct1 linker domain and OCA-B N terminus. Green serines: putative ERK phospho-acceptor sites. Yellow: similar or identical amino acids. Asterisks: known human point mutations that block coactivator binding and cause androgen insensitivity syndrome in humans. Pairwise alignments were performed using the FASTA algorithm (https://embnet.vital-it.ch/software/LALIGN_form.html) and trimmed for three-way overlap. (C) Alignment of human and mouse primary OCA-B peptide sequences. (D) coIP of Jmjd1a with L31A/R34A double-point mutant OCA-B and WT control. HCT116 cells transfected with WT or mutant OCA-B constructs were used. Protein expression was checked 48 h after transfection by Western blotting. 50 µg input protein was loaded in lanes 1–3. (E) Indicated peptide sequences were synthesized as C-terminal Tat fusions for membrane permeability. Arrows indicate position of mutant in B and D. (F) Il2 mRNA expression in primary naive CD4+ T cells treated with 50 µM JumOCA peptide was measured relative to β-actin internal standard by RT quantitative PCR. Cells were stimulated with CD3ε/CD28 antibodies for 2 d, rested for a further 8 d in the presence of exogenous recombinant IL-2, and restimulated for 6 h. Peptide was included during resting and restimulation only and replaced every other day with media changes. Three independent biological replicates were used for each condition. Tat vs. JumOCA restimulated (Restim) Student’s t test P value = 0.0007. Tat vs. vehicle Student’s t test P value = 0.0022. (G) IL-2 cytokine expression in primary naive CD4+ T cells cultured with 50 µM peptide at initial treatment and with 25 µM peptide from the secondary treatment was measured by flow cytometry. Cells were treated similarly to those in F except collection, brefeldin A treatment, and processing for flow cytometry occurred 24 h after restimulation. Three independent biological replicates were used for each condition. Vehicle vs. JumOCA Student’s t test P value = 9.62 × 10⁻⁷. Scrambled peptide vs. JumOCA Student’s t test P value = 0.0006. (H) CD4+CD44+IL2+ T cell frequencies from representative samples in G. Plots were gated on CD4 and CD44. (I) Peptide effects on the interaction between OCA-B and Jmjd1a were measured by coIP. M12 B cells were used. After incubation with protein-G beads, 0.2 µg/µl control scrambled (Scram), double-point mutant (DM) peptide, or JumOCA peptide were added for a further 3 h before precipitation and washing. 1% input (lane 1) is shown as a control. All error bars denote ±SEM. **, P ≤ 0.01; ***, P ≤ 0.001; ****, P ≤ 0.0001. n.s., not significant.

