Figure S2.
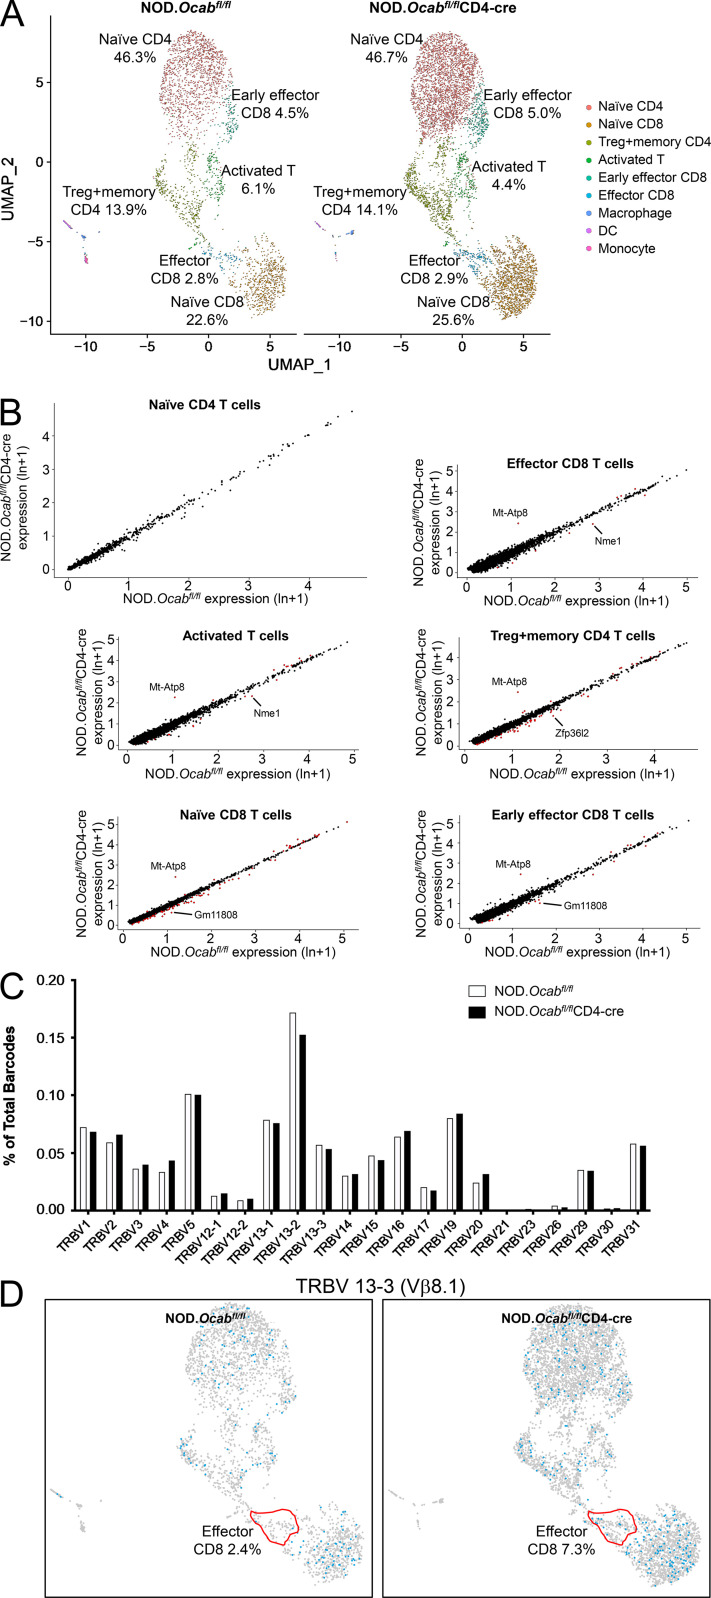
Unaltered T cell populations and TCR representation in prediabetic NOD.Ocabfl/flCD4-cre PLNs compared with NOD.Ocabfl/fl littermate controls. (A) CD3+ T cells were isolated and combined from the PLNs of three 8-wk-old NOD.Ocabfl/flCD4-cre mice or three NOD.Ocabfl/fl littermate controls. scRNAseq was performed. Clusters were overlaid in UMAP plots. DC, dendritic cell. (B) Six different populations from A were analyzed for differential gene expression. Identified genes are shown as scatter plots. Significantly differentially expressed genes (adjusted P value <0.05) are shown in red. ln, natural logarithm. (C) Percentage contribution of individual variable β chains is shown. (D) Trbv13-3–expressing cells are shown in blue superimposed on the same UMAP scRNAseq data as in A. The effector CD8+ T cell cluster is highlighted in red.

