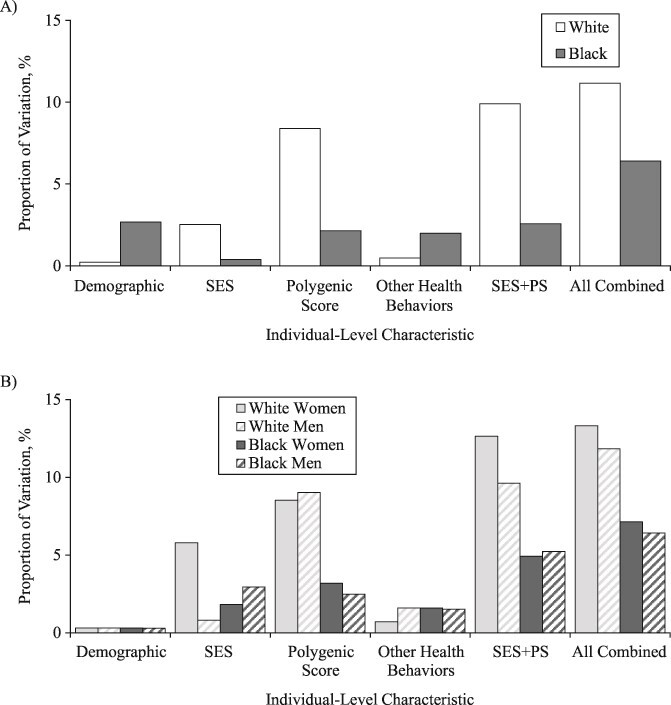
Figure 2.

Proportion of variation in log(BMI) explained by demographic, socioeconomic status (SES), polygenic score (PS), and health behaviors, separately and jointly, stratified by (A) race/ethnicity and (B) race/ethnicity and sex, US National Longitudinal Study of Adolescent to Adult Health Wave IV, 2007–2008. BMI, body mass index.
