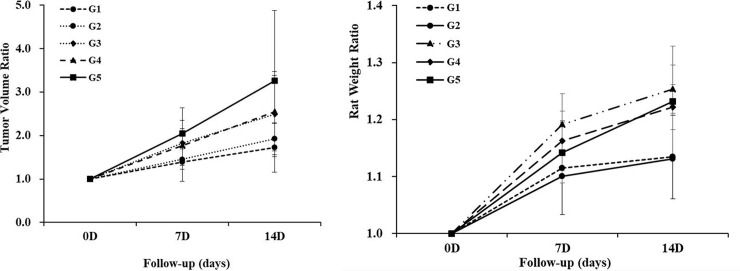
Fig 3. Serial changes of the relative tumor growth and rat weight.
(A) The tumor volume on a specific day divided by the baseline tumor volume showed the most delayed tumor growth at two weeks in the G1 group (P = 0.008). (B) The rat weight on a specific day divided by the baseline weight showed the slow increasing tendency of the rat two weeks in the G1 group. However, there was no significant difference between the control group and the G1 group (P > 0.05).

