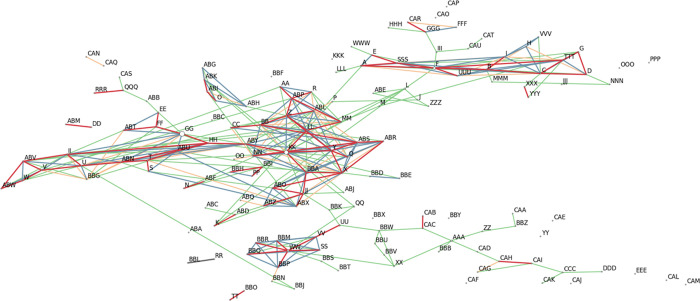
Fig 8. Haplotype network based on six cpSSR markers genotyped in three data sets F, C and G.
Size of the nodes reflects number of individuals assigned to the respective haplotype. The percolation threshold is 2.67 Red lines present the closest links, blue to green, yellow and no colour lines indicate links following decreasing relationship between haplotypes.

