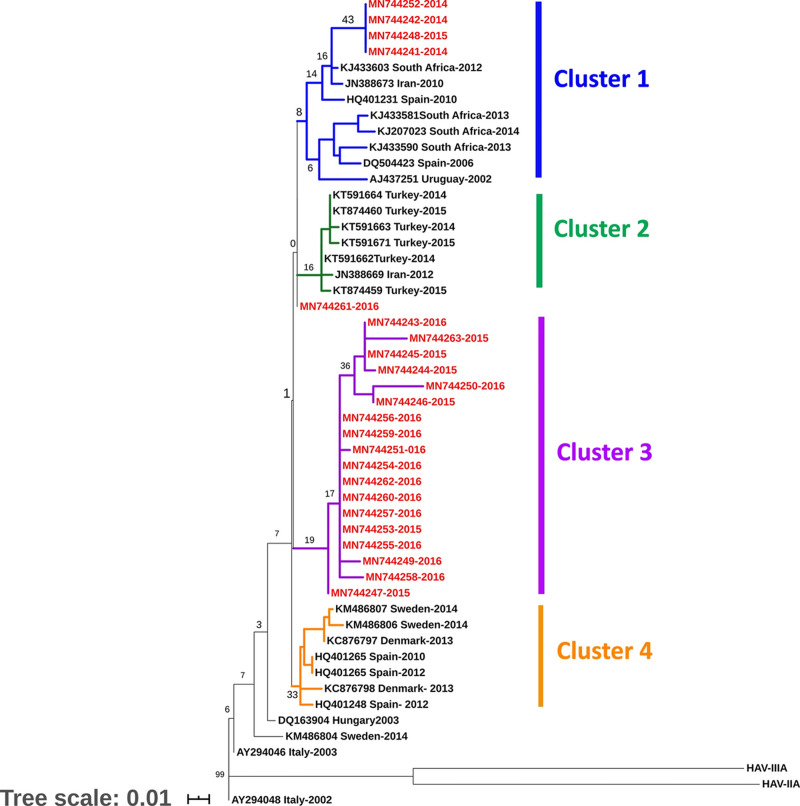
Fig 1. Consensus maximum likelihood phylogenetic tree (1000 replicates) based on VP3/VP1 region.
The percentage of trees in which the associated taxa clustered together is shown next to the branches. The branch labels in red represent the study sequences, while the black labels represent the sequences retrieved from the gene bank. The different color branches depict different clades. The tree is drawn to scale, with branch lengths measured in the number of substitutions per site. This analysis involved 51 nucleotide sequences conducted in n MEGA X [15, 19].

