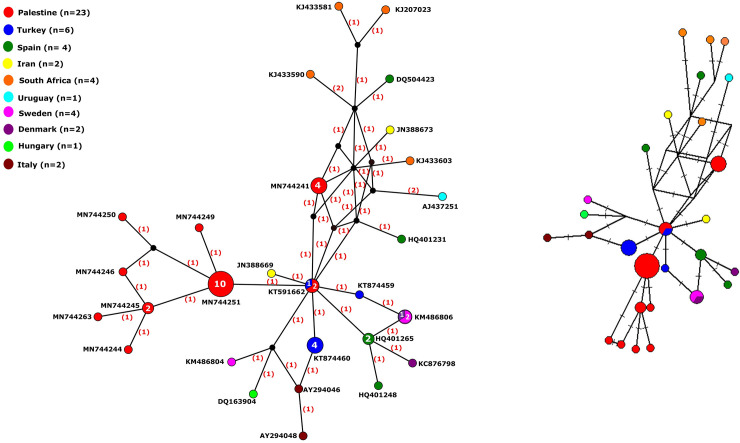
Fig 2.
(a) Median-joining haplotype network of HAV viral haplotypes constructed using PopArt 1.7. (b) Median-joining haplotype network reconstructed using Network 10. The network analysis included 28 multiple viral haplotypes of HAV from 2014–2018. Each circle represents a unique haplotype, color represents country of genome origin, and the size of the circle is proportional to number of viral genomes included. The numbers in bracket in (a) represent the number of single nucleotide variations (SNVs) between haplotypes. The lines on the branches in (b) represent the mutated position with one line per mutation.

