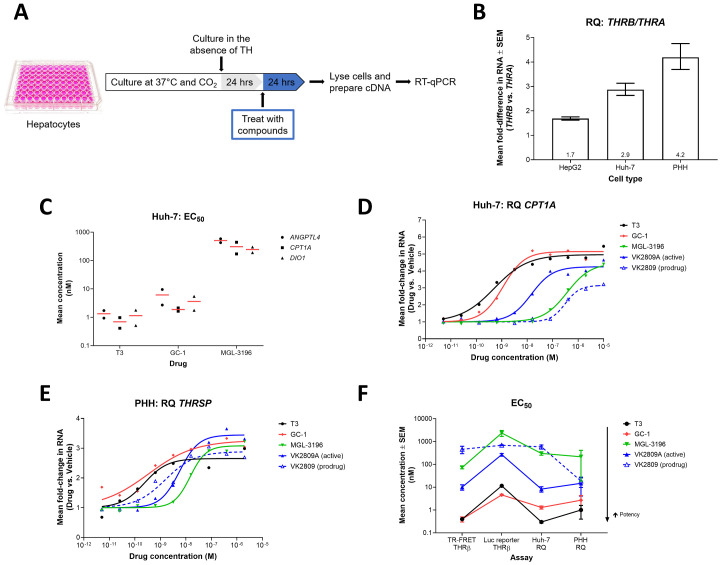
Fig 2. Differential gene expression in Huh-7 cells and PHH resulting from treatment with THR agonists.
(A) Illustration of the in vitro, hepatic cell-based differential gene expression assay design. (B) THRB and THRA RNA levels were quantified by RT-qPCR in HepG2 (n = 3), Huh-7, (n = 3), and PHH (n = 5) cells. Mean RQ values ± SEM are reported with means annotated within the bars. (C) Huh-7 cells were treated with increasing doses of T3 (n = 2), GC-1 (n = 2), or MGL-3196 (n = 2) for 24 hrs. ANGPLT4, CPT1A, and DIO1 RNA levels were quantified by RT-qPCR and dose-response curves were generated for each gene-compound combination. Mean EC50 values (red bar) and individual replicate EC50 values (black symbols) are reported. (D) Huh-7 cells were treated with increasing doses of T3 (black), GC-1 (red), MGL-3196 (green), VK2809A (solid blue), or VK2809 (dashed blue) for 24 hrs. CPT1A RNA levels were quantified by RT-qPCR. Representative mean RQ values at each compound concentration and fitted dose-response curves are reported. (E) PHH were treated with increasing doses of T3 (black), GC-1 (red), MGL-3196 (green), VK2809A (solid blue), or VK2809 (dashed blue) for 24 hrs. THRSP RNA levels were quantified by RT-qPCR. Representative mean RQ values at each compound concentration and fitted dose-response curves are reported. (F) EC50 values for every test compound were calculated from dose-response curves generated from the TR-FRET THRβ, luciferase (Luc) reporter THRβ, Huh-7 differential gene expression (RQ), and PHH RQ assays (data reported in Tables 1 and 2). Mean EC50 values ± SEM are reported.

