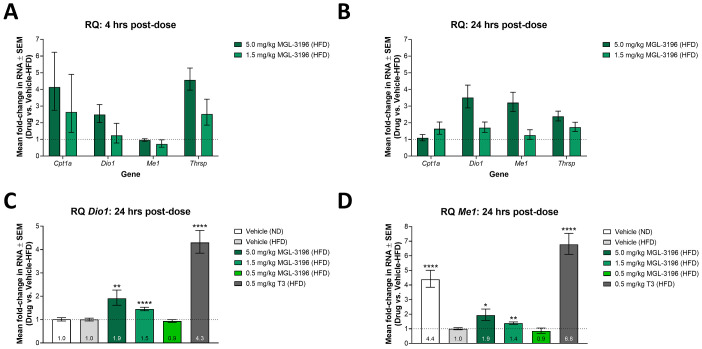
Fig 4. Modulation of liver gene expression after single-dose treatment of MGL-3196 or T3 in HFD fed rats.
(A) After two weeks of consuming a HFD, animals were dosed once with vehicle (n = 6), 5.0 mg/kg MGL-3196 (n = 3), or 1.5 mg/kg MGL-3196 (n = 3). Four hrs later, the animals were sacrificed and liver Cpt1a, Dio1, Me1, and Thrsp RNA levels were quantified by RT-qPCR. Results are presented as expression relative to the expression levels in vehicle-control rats. Mean RQ values ± SEM are reported. (B) Animals were treated as in A) except that they were sacrificed 24 hrs post-dosing and gene expression analysis was conducted in the same manner. Results are presented as expression relative to the expression levels in vehicle-control rats. Mean RQ values ± SEM are reported. (C) The rats described in Fig 3 were sacrificed 24 hrs after compound treatment and liver Dio1 RNA levels were quantified by RT-qPCR. Results are presented as expression relative to the expression levels in HFD fed, vehicle-control rats. Mean RQ values ± SEM are reported with mean values annotated within the bars. Statistical analysis was performed using Brown-Forsythe and Welch ANOVA tests on the ΔΔCt values. The mean of each group was compared to the mean of the HFD fed, vehicle-control group; **P < 0.01, ****P < 0.0001. (D) Liver Me1 expression was quantified in the same rats as described in C) and in the same manner. Results are presented as expression relative to the expression levels in HFD fed, vehicle-control rats. Mean RQ values ± SEM are reported with mean values annotated within the bars. Statistical analysis was performed using Brown-Forsythe and Welch ANOVA tests on the ΔΔCt values. The mean of each group was compared to the mean of the HFD fed, vehicle-control group; *P < 0.05, **P < 0.01, ****P < 0.0001.

