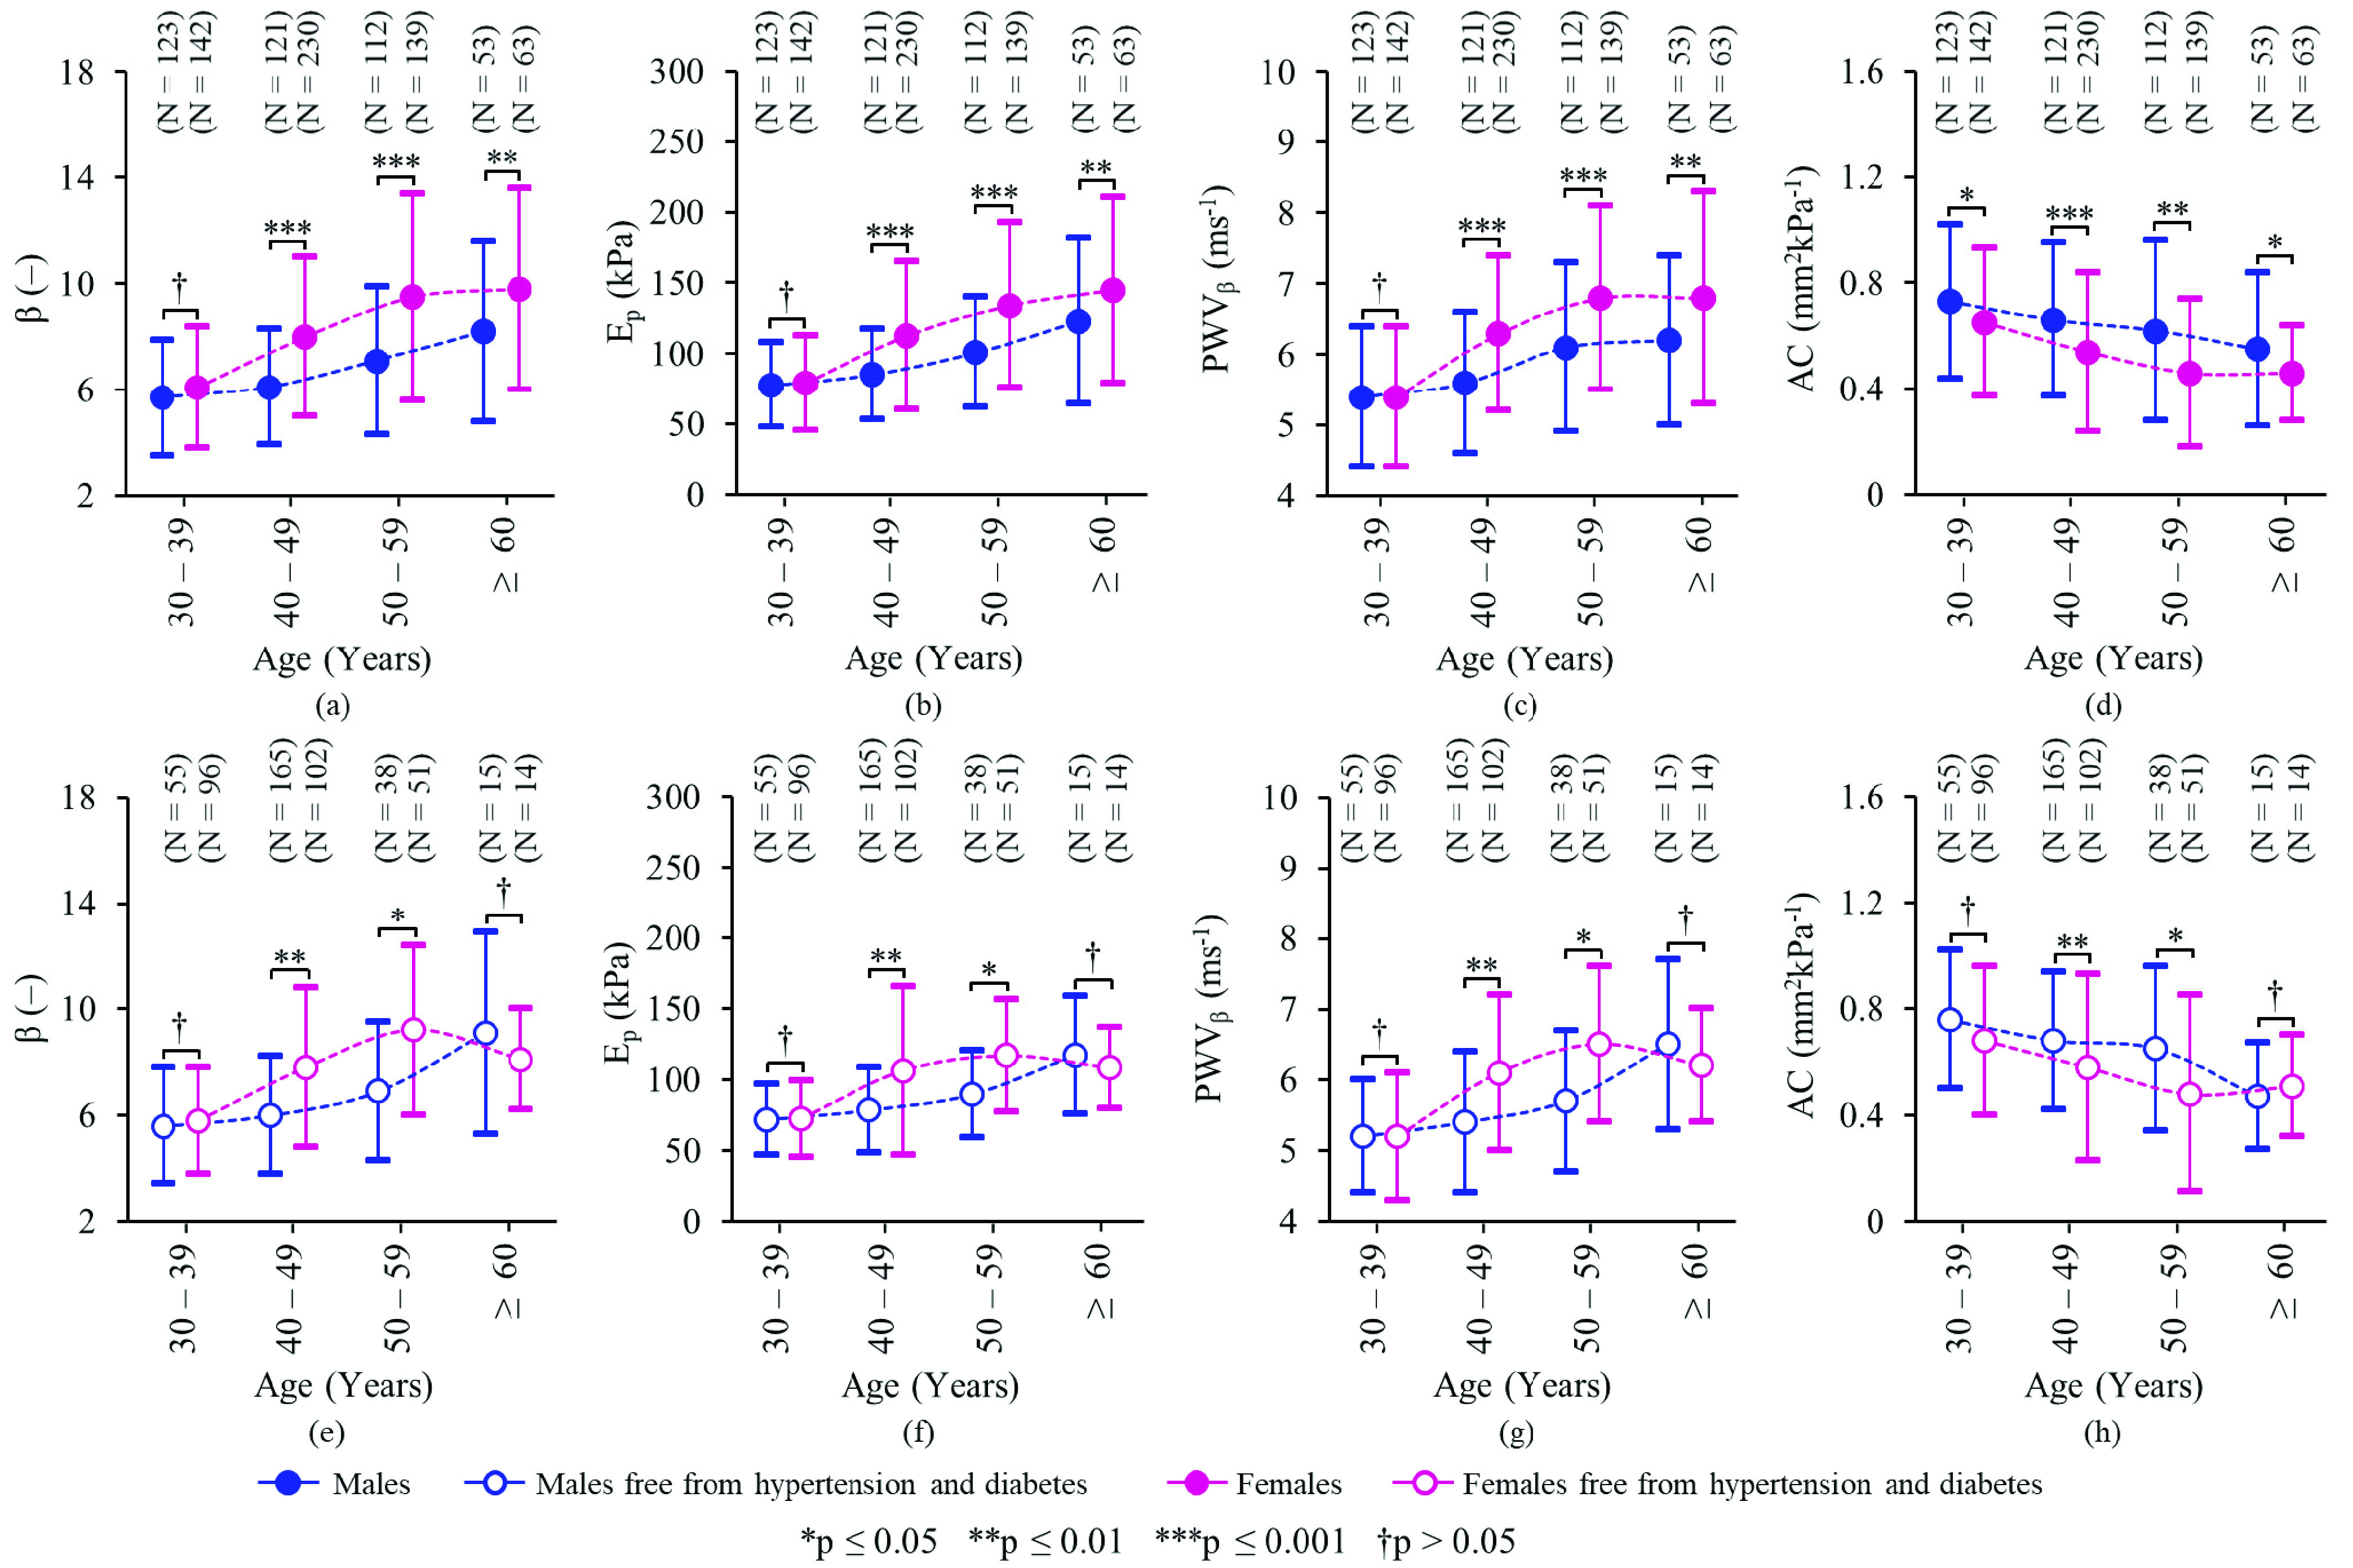
FIGURE 2.

Gender-specific distribution of carotid stiffness indices (mean ± standard deviation of  , Ep, PWV
 , and AC) across decades of age: (a – d) for the entire population (N = 983), and (e – h) for a subgroup excluding hypertensives and/or diabetes patients (N = 440).
