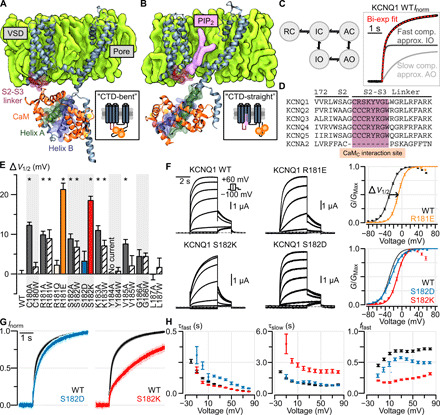
Fig. 1. The S2-S3 linker within the KCNQ1 VSD modulates KCNQ1 currents.

(A and B) Structural depiction of one monomer of the tetrameric KCNQ1/CaM complex when determined in the absence (A) and presence (B) of PIP2 [i.e., CTD-bent (A) and CTD-straight (B) conformations]. (C) Left: A simplified KCNQ1 gating model (16, 18–21) with two open states: IO and AO. Horizontal transitions correspond to VSD activation, vertical transitions correspond to pore opening. RC, resting closed; IC, intermediate closed; AC, activated closed. Right: Exemplar biexponential activation kinetics fitting of a Q1-WT normalized current. Voltage was stepped from −80 to 0 mV. (D) Sequence alignment of the KCNQ family and KCNA2 at the S2-S3 linker region predicted to interact with CaM. (E) Mutagenesis screen of the KCNQ1 S2-S3 linker region shown in (D). Y axis: ΔV1/2 from WT channel [see (F) for example]. X axis: residue position. Stars indicate significant ΔV1/2 from WT (table S1). Error bars are SEM. (F) Left: Exemplar recordings from KCNQ1 WT and S2-S3 linker mutant channels. Voltage protocol is shown in inset. Currents were collected with 10-mV increments at the test pulse but shown in 20-mV increments to avoid crowding. Right: Average G-V relationship for the respective channels. An example of ΔV1/2 measurement is shown for mutant R181E. (G) Average normalized KCNQ1 channel activation kinetics, stepping from −80 to 0 mV, for Q1-WT (black, n = 10), Q1-S182D (blue, n = 7), and Q1-S182K (red, n = 10) channels. The light shadings show SEM. (F) Average biexponential kinetic fit parameters for Q1-WT (black), Q1-S182D (blue), and Q1-S182K (red) channels at different test voltages. Error bars are SEM. τfast and τslow are the time constants for the fast and slow components, respectively. ffast is fraction of total current contributed by the fast component.
