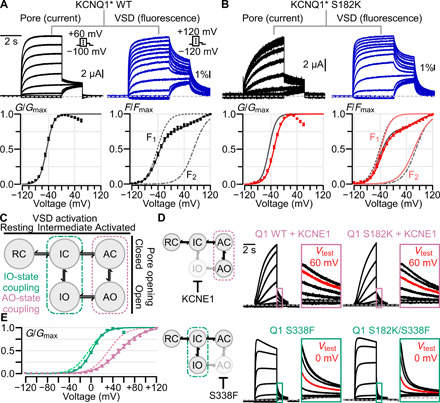
Fig. 4. CaM-VSD interactions control AO state occupancy.

(A) VCF experiments using KCNQ1* psWT. Left and right columns: Exemplar ionic current/VSD fluorescence signal measurements (voltage protocols in inset) and average G-V/F-V relationships, respectively. The F-V relationship (solid black curve) is fitted with a double Boltzmann equation (F1 and F2, dotted black curves), see Materials and Methods. (B) Same as (A), but for KCNQ1* S182K mutant channel. In G-V and F-V plots: black, psWT; red, S182K. (C) KCNQ1 gating model with two open states, IO and AO. The KCNQ1 VSD transitions into the intermediate and activated conformations engage distinct sets of VSD-pore coupling interactions (green and violet boxes) to trigger pore opening. (D) Left: Cartoon schematic illustrating the effect of KCNE1 coexpression (top) and Q1-S338F mutation (bottom) to ablate the IO and AO states respectively to leave KCNQ1 to conduct only at one open state. Right: Current exemplars for Q1-WT and mutant channels designed to probe whether Q1-S182K mutation specifically affects IO or AO state. Each box shows enlarged tail currents, with the red trace indicating the tail current associated with the labeled test voltage, which shows the shift of voltage dependence when comparing the WT and mutant. Voltage protocol same as in (A), except for exemplar currents with KCNE1 coexpression test pulses range from −120 to +100 mV. (E) Average G-V curve and Boltzmann fits for Q1-WT + KCNE1 (dotted pink, n = 5), Q1-S182K + KCNE1 (solid pink, n = 7), Q1-S338F (dotted green, n = 6), and Q1-S182K/S338F (solid green, n = 11).
