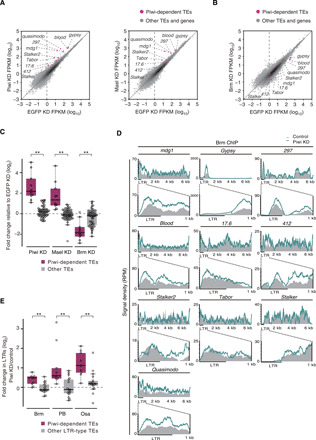
Fig. 2. Brm plays a role in the transcriptional activation of Piwi-targeted transposons.

(A) Scatter plots showing the expression levels of Piwi-dependent transposons relative to EGFP KD OSCs in Piwi (left) and Mael (right) KD OSCs. Magenta plots represent Piwi-dependent transposons (TEs) (fig. S2B), and gray plots represent other TEs and genes (see Materials and Methods). (B) Scatter plots showing the expression levels of Piwi-dependent TEs relative to EGFP KD OSCs in Brm KD OSCs. Magenta plots represent Piwi-dependent TEs, and gray plots represent other TEs and genes. (C) Box plots showing fold changes in the expression levels of Piwi-dependent TEs (10 TEs) and other TEs (49 TEs) in Piwi, Mael, or Brm KD OSCs. **P < 0.01. (D) Density plots for normalized Brm ChIP-seq signals over Piwi-dependent TEs in control and Piwi KD OSCs (gray infill and colored lines, respectively). RPM, reads per million. (E) Box plots showing the fold changes in ChIP-seq signals of Brm, Osa, and PB in LTRs of Piwi-dependent LTR-type TEs except stalker (9 TEs) and other LTR-type TEs (17 TEs) upon Piwi depletion in OSCs. **P < 0.01.
