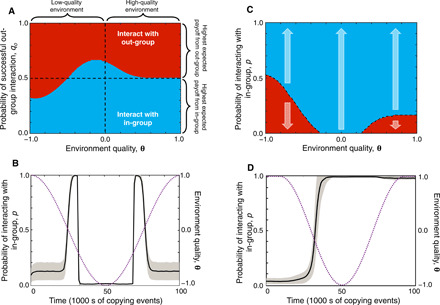
Fig. 2. Polarization in a declining economy.

Evolutionary dynamics of polarization. In the cases shown, we fix Bi = 0.5, Bo = 1, and qi = 1. Utility (Eq. 1) has threshold sharpness h = 10, and gradient α = 0.02. The number of social interactions per individual is n = 5. (A) We calculate the strategy p* that maximizes utility from Eq. 4 (see Methods). When the success of out-group interactions is independent of the strategy of the interaction partner, only one stable strategy evolves, either a highly polarized (p = 1, blue) or a highly diverse strategy (p = 0, red). (B) Individual-based simulations in which individuals copy more successful members of the population (selection strength σ = 10). The purple dotted line tracks the quality of the environment θ. The population size is fixed at N = 1000 with qo = 0.6. Shown are the mean population strategy (black line) across an ensemble of 1000 simulations and the standard deviation (SD) of the strategy distribution for the ensemble (gray region). Innovations occur at rate μ = 0.001 per copying event with size Δ = 0.01 (see section S4). (C) When the success of out-group interactions depends on the strategy of the interaction partner, two or more strategies can be bistable. Arrows indicate the direction of evolution in a large population, in a given environment θ. Blue regions indicate the basin of attraction for polarization p* = 1, while red regions indicate the basin of attraction for diversity p* = 0. We have set qo = 0.6. (D) Individual-based simulations show how polarization increases in a declining economic environment and remains even when the environment returns to being favorable. Parameters for (C) are the same as those given for (B).
