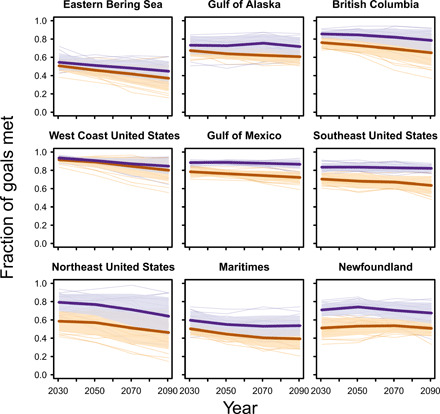
Fig. 2. Comparison of present-only plans that only consider current conditions (orange) and “proactive” ocean plans that also consider species redistributions (purple).

Success is expressed as the fraction of planning goals that are met by each plan at a given time. Thick lines show averages, thin lines show individual projections, and shading shows ±1 SD across the projections from eight global climate models used for testing and two greenhouse gas emissions scenarios (RCP2.6 and RCP8.5).
