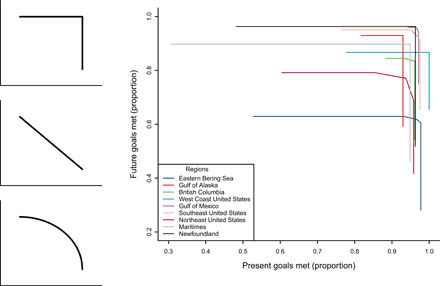
Fig. 4. Curves that delineate the trade-off between the ability to meet planning goals in the present (x axis) or in the future (y axis).

Left-hand images illustrate (from top to bottom) curves that have no trade-off, a direct trade-off, and a concave trade-off (20). The main figure shows curves for the nine regions around North America. Points on each line are generated by weighting present versus future goals to a greater or lesser extent with a limited total plan area (75% of the area needed to meet all present and future goals at once). The ends of each line indicate no attempt to meet one of the goal types. Areas of 50 or 90% are shown in fig. S1.
