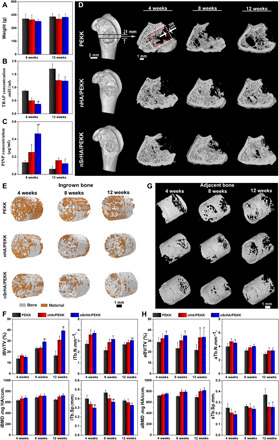
Fig. 4. Serum biomarker measurements and microcomputed tomography (μ-CT) evaluation of osteoporotic bone regeneration induced by different scaffolds.

(A) Animal weight change, (B) serum levels of TRAP, and (C) PINP of ovariectomized rats implanted with different scaffolds at weeks 8 and 12 postoperatively. (D) μ-CT images showing overall view of the bone specimens and cross-sectional view of the distal femur bone with various scaffold implantation (transparent) at weeks 4, 8, and 12 postoperatively. (E) Reconstructed μ-CT images of the newly formed bone (gray) within the porous scaffolds (yellow) and (F) μ-CT–rendered parameters of ingrown bone at different time points. (G) Reconstructed μ-CT images of the adjacent bone tissue (gray) and (H) μ-CT–rendered parameters of adjacent bone at different time points (error bars, means ± SD, n = 5 per group, *P < 0.05 significant as compared to PEEK, #P < 0.05 significant as compared to nHA/PEEK). All analyses were done using one-way ANOVA with Tukey’s post hoc test.
