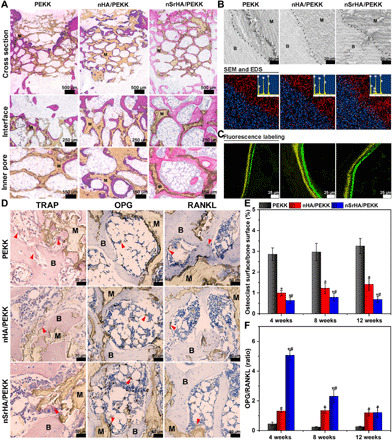
Fig. 5. Histological analysis for osteoporotic bone regeneration and immunohistological analysis for osteoporotic bone resorption induced by different scaffolds.

(A) Hematoxylin and eosin (H&E) staining of histological sections from different groups at week 12 postoperatively (M, material; B, new bone). (B) SEM observation and EDS analysis for the histological sections of the retrieved samples at week 12 (red, carbon; blue, calcium; white, strontium). (C) In vivo sequential fluorescence labeling of new bone formation (yellow, tetracycline label; green, calcein label). (D) TRAP, OPG, and RANKL staining of histological sections from different groups at week 12 postoperatively (M, material; B, bone tissue; arrow, osteoclast). (E) Quantitative analysis of osteoclast surface–to–bone surface ratio and (F) OPG-to-RANKL positive staining ratio of the newly formed bone tissue induced by various scaffolds (error bars, means ± SD, n = 5 per group, *P < 0.05 significant as compared to PEEK, #P < 0.05 significant as compared to nHA/PEEK). All analyses were done using one-way ANOVA with Tukey’s post hoc test.
