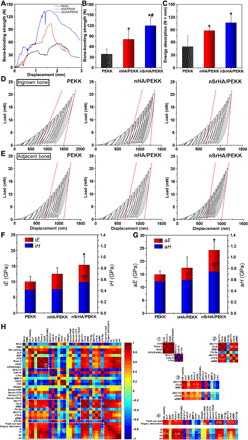
Fig. 6. Effect of different scaffolds on new bone strength at macro- and microlevel and confusion matrix of preimplantation and postimplantation parameters according to their pairwise correlations.

(A) Typical load-displacement curves, (B) maximum load, and (C) energy absorption generated from macrolevel mechanical testing of different implants at week 12 postoperatively. (D) Typical load-displacement curves generated from cyclic nanoindentation testing on ingrown new bone and (E) adjacent new bone (dotted red line, stiffness). (F) Averaged iH and iE calculated from 800- to 1000-nm indentation depth. (G) Averaged aH and aE calculated from 800- to 1000-nm indentation depth. (H) The color intensity indicates the magnitude of the correlation coefficient, ranging from −1 to 1 (deep blue to red). Blue and red represents negative and positive correlation. The correlation coefficient was calculated by Pearson’s correlation analysis, and significant correlations were identified for P values <0.05. Four regions (① to ④) in the matrix represents parameters that were highly correlated, closing to 1 or −1. Cross mark indicates no significant correlation (error bars, means ± SD, n = 5 per group, *P < 0.05 significant as compared to PEEK, #P < 0.05 significant as compared to nHA/PEEK). All analyses were done using one-way ANOVA with Tukey’s post hoc test.
