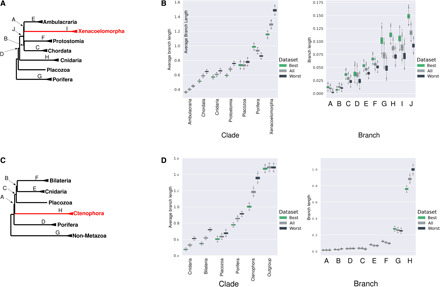
Fig. 6. Best genes have short terminal branches and longer internal branches.

(A) A tree showing the clades (names) and branches (letters) for which lengths were estimated for the Philippe data. (B) Estimates of clade and branch lengths for empirical data using a site-heterogeneous model for three data samples: best genes (green, highest monophyly scores), all dataset (gray), and worst genes (black, lowest monophyly scores). Best genes have shorter terminal branches within clades than all or worst. Best genes have longer branches separating clades than all or worst. (C) A tree showing the clades (names) and branches (letters) for which lengths were estimated for the Simion data. (D) Estimates of clade and branch lengths for the Simion-best, Simion-all and Simion-worst genes. Best genes have shorter terminal branches within clades than all or worst. For the best genes, most internal branches are the same or longer than for all or worst genes with the exception of the internal branch leading to the Ctenophora clade.
