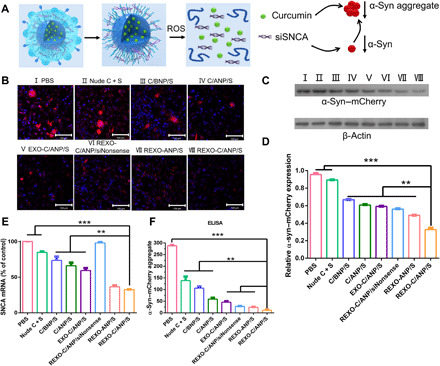
Fig. 3. Effective pathological inhibition.

(A) Scheme of REXO-C/ANP/S synergistic effect against α-syn. (B) Effect of NPs on decrease in α-syn aggregates after NPs were incubated with SNCA–mCherry–SH-SY5Y cells. Scale bars, 100 μm. (C) Mouse α-syn–mCherry (anti–α-syn antibody) protein levels relative to β-actin by Western blot. Western blot band of cells incubated with different NPs. I, PBS; II, nude C + S; III, C/BNP/S; IV, C/ANP/S; V, EXO-C/ANP/S; VI, REXO-C/ANP/siNonsense; VII, REXO-ANP/S; and VIII, REXO-C/ANP/S. (D) Total α-syn protein levels were quantified relative to β-actin. (E) Total SNCA mRNA expression levels were quantified by quantitative reverse transcription polymerase chain reaction. (F) Total α-syn aggregate expression levels were quantified by ELISA. In (B) to (D) and (F), NPs were incubated with cells for 72 hours. In (E), NPs were incubated with cells for 36 hours. **P < 0.01 and ***P < 0.001.
