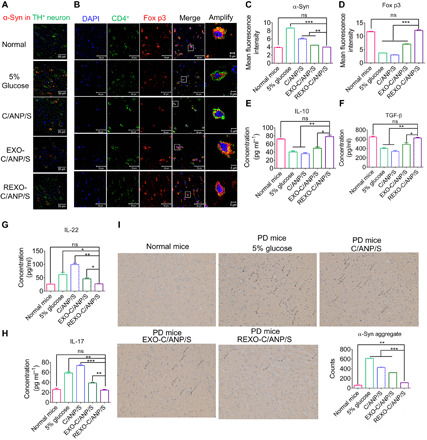
Fig. 5. Nanoscavenging for PD mice.

(A) Immunofluorescence staining (anti-TH antibody and anti–α-syn antibody) of normal mice and different NP-treated PD mice. Scale bars, 50 μm. (B) Immunofluorescence staining (anti-CD4 antibody and anti–Fox p3 antibody) of normal mice and different NP-treated PD mice. Scale bars, 50 μm. The amplify images were the images in the white square, with a 5-μm scale bar. (C) α-Syn mean fluorescence intensity in (A). (D) Fox p3 mean fluorescence intensity in (B). (E) IL-10 concentration in serum of PD mice treated with NPs. (F) TGF-β concentration in serum of PD mice treated with NPs. (G) IL-22 concentration in serum of PD mice treated with NPs. (H) IL-17 concentration in serum of PD mice treated with NPs. (I) Conformation-specific α-syn aggregate immunohistochemistry staining (anti-conformation–specific MJFR α-syn aggregate antibody) of the brain slides in treated mice SN region. *P < 0.05, **P < 0.01, and ***P < 0.001.
