
Fig. 1. GFA and crystallization thermodynamics.
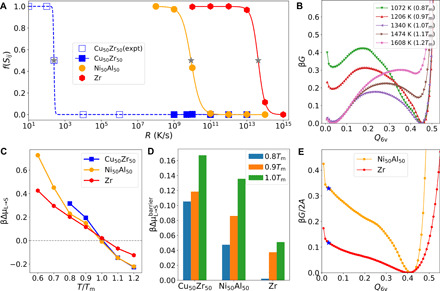
(A) Fraction of the crystalline atoms of the solid phase, f(Sij), obtained upon cooling for various Rs. The filled symbols are the data obtained from MD simulations, whereas the open symbols represent the experimental data for CuZr. The gray stars locate Rc for each material estimated from the criterion of f(Sij) = 0.5. The lines are fits to the data. (B) Free-energy profiles of CuZr liquids with respect to the collective variable Q6v at different temperatures. (C) Temperature dependence of the thermodynamic driving force scaled by the thermal energy for crystallization per particle, βΔμL → S. (D) Thermal energy–scaled free-energy barriers for the liquid-to-crystal transformation, , measured from the corresponding free-energy profiles. (E) Free-energy profiles of NiAl and Zr at Tm with the presence of planar crystal/liquid interfaces (A, the interface area). The blue stars indicate the position of the corresponding free energy of the equilibrium liquid phase.