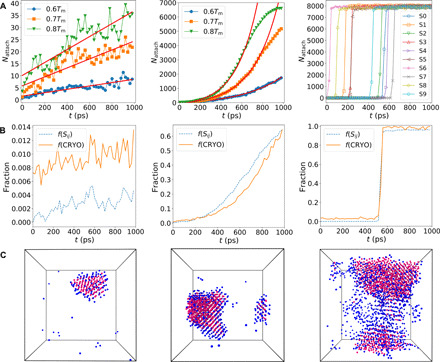
Fig. 5. Crystal growth kinetics and its structural mechanism in supercooled liquids.

The figures of each row from left to right are for CuZr, NiAl, and Zr, respectively. (A) Temporal change in the net number of particles attached to the crystal nucleus, Nattach, at different undercooling. CuZr exhibits a linear growth mode, as indicated by the solid lines from linear fits. For NiAl, the data at 0.6Tm are multiplied by a factor of 5 for clarity. The solid curves are exponential fits. The deviations of the data from the solid curves are due to the finite sizes of the systems. For Zr, we show the temporal change of Nattach for 10 independent simulation runs at 0.7Tm. The system crystallizes quickly after some incubation, and then, the growth finishes almost instantaneously. (B) Comparisons of the fraction of the crystallized atoms (dashed curve) and that of the precursors (or CRYO) (solid curve) in the remaining liquid phase at 0.7Tm. (C) Snapshots of the spatial distribution of the crystalline phase (magenta atoms) and the precursors (or CRYO) (blue atoms). The degree of wettability of the precursors to the crystal increases with a decrease in GFA.
