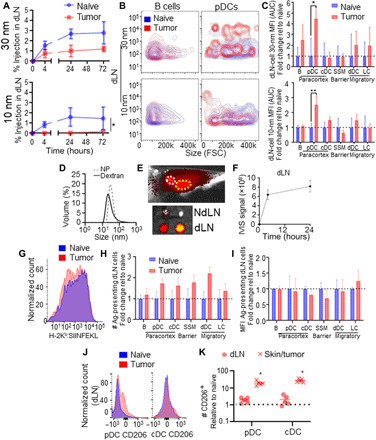
Fig. 3. Passive lymphatic drainage in the naïve and melanoma contexts.

(A) Thirty- and 10-nm dextran bulk accumulation in LNs draining skin or day 7 B16F10 melanomas over time. (B) Representative flow cytometry plots of 30- and 10-nm dextran accumulation within B cells and pDCs of the dLN. FSC, forward scatter. (C) MFI of 30- and 10-nm tracer signal in LNs draining the skin or B16F10 melanomas over 72 hours after injection (AUC). (D) Dynamic light scattering measurements of 500-kDa (30 nm) dextrans and Ag-NPs. (E) NPs (30 nm) injected intradermally accumulate within axillary (white circle) and brachial (yellow circle) dLNs 24 hours after intradermal injection (positive pixels as collected by IVIS imaging are red-yellow, negative background is gray scale), quantified in (F). Flow cytometry histograms of Ag presentation (25D1.16 staining for H-2Kb:SIINFEKL) among CD45+ cells within dLNs (G), number of dLN cells presenting Ag relative to the naïve condition (H), and as MFI of H-2Kb:SIINFEKL signal of positive dLN cells (I) 24 hours after intradermal injection of Ag-NP. CD206 signal (J) among pDCs and cDCs in the skin/tumor and dLN of naïve and day 10 B16F10-bearing animals, quantified in (K), normalized to values in naïve skin and dLN. * indicates significance by one-way ANOVA with Tukey’s post hoc comparison (* indicates P < 0.05, ** indicates P < 0.01); n = 5 to 6 animals; (A) to (F) are representative of at least two independent experiments.
