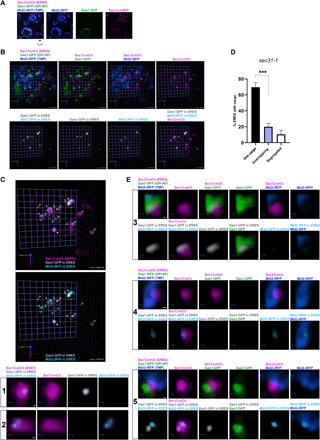
Fig. 2. Newly synthesized C26 ceramide–based GPI-APs and transmembrane cargos are recruited to different ERES.

sec31-1 cells expressing galactose-inducible secretory cargos, Gas1-GFP (GPI-AP, green) and Mid2-iRFP (TMP, blue), and constitutive ERES marker Sec13-mCherry (ERES, magenta) were incubated at 37°C for 30 min, shifted down to 24°C for releasing secretion block, and imaged by SCLIM after 20 min. (A to C) Representative 2D projection images of 10 z-sections (A; scale bar, 1 μm) or 3D cell hemisphere images (B and C; scale unit, 0.456 μm) of cargo and ERES markers. Lower panels in (B) and panels in (C) show processed images to display only the cargo [Gas1-GFP (gray) and Mid2-iRFP (light blue)] present in the ERES (magenta). (C) Open arrowheads: ERES with just one cargo (1 to 4). Gray filled arrowheads: ERES containing segregated cargos (5). White filled arrowhead: ERES containing colocalizing cargos. Lower panels: selected individual ERES containing only Gas1-GFP (1) or Mid2-iRFP (2). Scale bar, 100 nm. (D) Quantification of micrographs described in (C). Average percentage of ERES containing only one cargo (Gas1-GFP or Mid2-iRFP), segregated cargos, and overlapping cargos. n = 432 in 54 cells in three independent experiments. Error bars = SD. Two-tailed, unpaired t test. ***P = 0.0002. (E) 3D images of selected ERES with segregated cargos marked in (C). Either Gas1-GFP (green) (3) or Mid2-iRFP (blue) (4) enters ERES (magenta) from one side and is confined in a small zone within the ERES. Occasionally, both cargos approach the same ERES (5) but from different sides and are restricted to segregated zones within the ERES. Scale bar, 100 nm.
