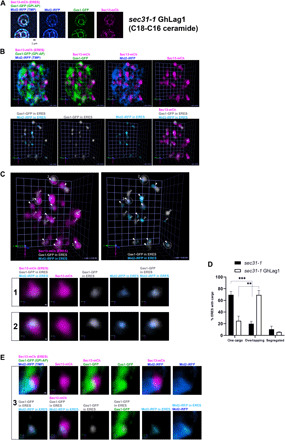
Fig. 4. C26 ceramide–based GPI-AP cargos are rerouted and enter the same ERES as transmembrane cargo in the ER membrane with C18-C16 ceramides.

sec31-1 GhLag1 cells expressing galactose-inducible secretory cargos, Gas1-GFP (GPI-AP, green) and Mid2-iRFP (TMP, blue), and constitutive ERES marker Sec13-mCherry (ERES, magenta) were incubated at 37°C for 30 min, shifted down to 24°C for releasing secretion block, and imaged by SCLIM after 20 min. (A to C) Representative 2D projection images of 10 z-sections (A; scale bar, 1 μm) or 3D cell hemisphere images (B and C; scale unit, 0.45 μm) of cargo and ERES markers. Lower panels in (B) and panels in (C) show processed images to display only the cargo [Gas1-GFP (gray) and Mid2-iRFP (light blue)] present in the ERES (magenta). (C) White filled arrowheads: ERES with overlapping cargo. Open arrowheads: ERES containing only one cargo. Lower panels: selected ERES with overlapping cargos (1 and 2) marked in (C). Scale bar, 100 nm. (D) Quantification of micrographs described in (C). Average percentage of ERES containing only one cargo (Gas1-GFP or Mid2-iRFP), segregated cargos, and overlapping cargos in sec31-1 and sec31-1 GhLag1 cells. n = 432 in 54 cells (sec31-1) and n = 430 in 47 cells (sec31-1 GhLag1) in three independent experiments. Error bars = SD. Two-tailed, unpaired t test. ***P = 0.0002 (sec31-1) and **P = 0.0031 (sec31-1 GhLag1). (E) 3D images of a selected ERES with overlapping cargos (3) marked in (C). Gas1-GFP (green) and Mid2-iRFP (blue) approach the ERES (magenta) from the same side and stay in the same ERES restricted zone. Scale bar, 100 nm.
