
Figure 2.
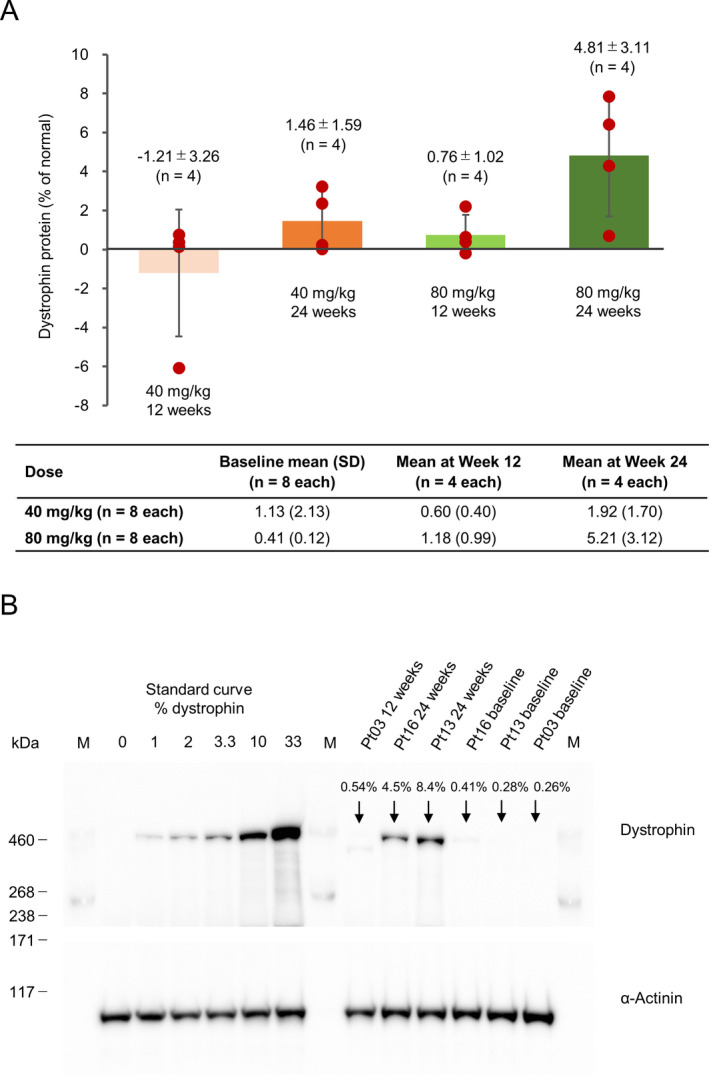
Dystrophin protein level by western blot (mean ± SD). A, Changes from baseline to 12 or 24 weeks. The figure shows the difference in the amount of dystrophin protein from baseline to 12 or 24 weeks (red circle: value for each case, bar: average value) ± standard deviation, and the table below the figure shows the amount of dystrophin protein before administration of viltolarsen (baseline) and the mean value (standard deviation) of the measured values of dystrophin protein at 12 and 24 weeks. “% of normal” = Data from Duchenne muscular dystrophy patients/data from healthy people, with % of normal calculated at baseline and after administration. The y‐axis indicates the changes (% normal 0 to Week 12 and % normal 0 to Week 24). After treatment, mean data include each of the four patients who had a biopsy performed, and dystrophin protein levels were evaluated at Week 12 and Week 24 in each group. Therefore, the mean change includes changes from baseline to Week 12 and Week 24. B, Western Blot images of patients 03, 13, and 16 after once‐weekly treatment with 80 mg/kg viltolarsen. The image depicts the data from one of the triplicate experiments conducted for this measurement. At baseline, there were no visible bands indicating the presence of dystrophin for these patients. However, after 24 weeks of treatment, clear bands for dystrophin appeared for both patients 13 and 16. SD, standard deviation.