
Figure 1.
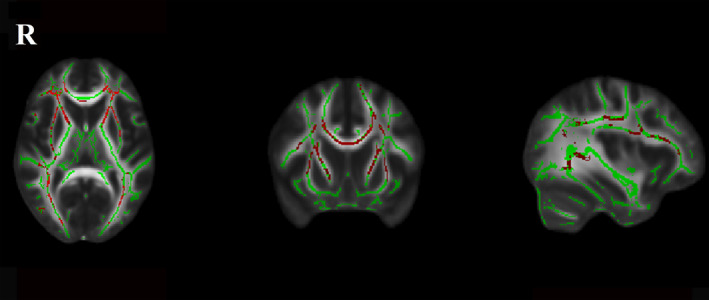
Fractional anisotropy between LA participants and controls. The figure shows white matter fibers’ significant fractional anisotropy reduction (Red Color) in LA participants compared with controls at the TBSS analysis (P < 0.05 corrected for multiple comparisons). The white matter tracts are superimposed to the FMRIB58_FA standard provided with FSL.