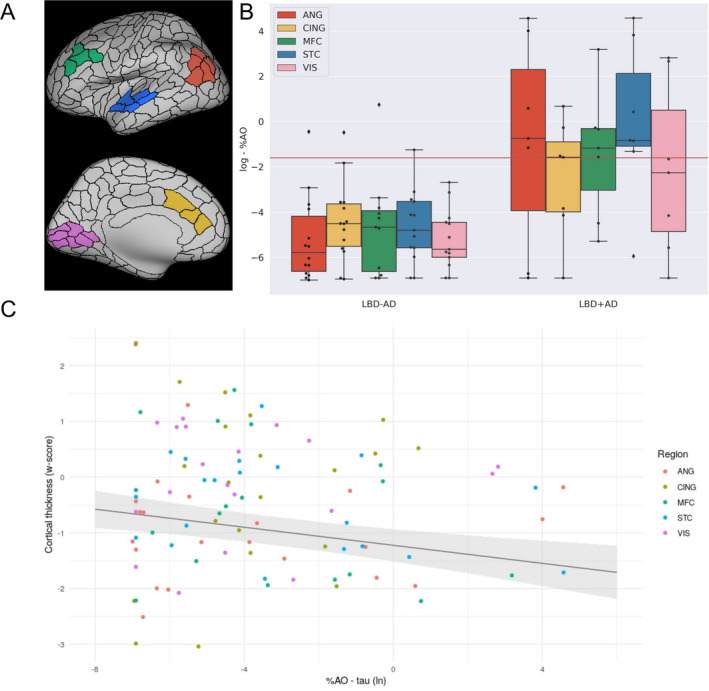
Figure 3.

Association between the in vivo estimates of cortical thinning and tau accumulation. Abbreviations: %AO, percentage of area occupied; ANG, angular gyrus; CING, anterior cingulate cortex; MFC, medial frontal cortex; STC, superior temporal cortex; VIS, visual cortex. (A) representation of the MRI‐ROIs on an inflated brain (Green = MFC, Blue = STC, Red = ANG, Yellow = CING and Pink = VIS). (B) Box‐plots depict the ln %AO distribution of tau pathology across the sampled regions. (C) The scatter plot represents the w‐score of median cortical thickness values plotted as a function of the percentage of area occupied of reactivity for tau in the tissue sample (log transformed). The regression line represents the fixed effect of the %AO and the gray area around the regression line covers the standard error around the regression estimate.
