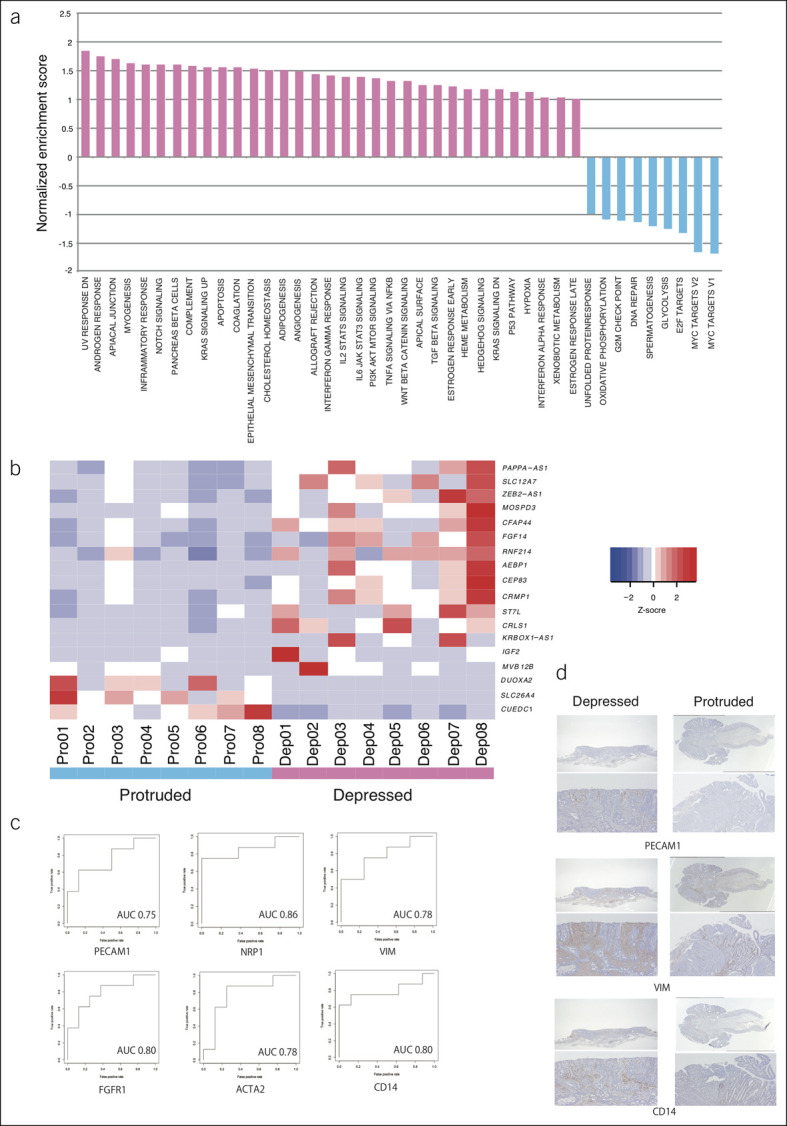
Figure 3.

RNA sequencing of depressed pT1 colorectal carcinomas. (a) Gene set enrichment analysis. (b) Expression of genes that were most differentially expressed between depressed and protruded carcinomas. (c) ROC curves of RNA expression of angiogenesis, EMT, and inflammatory related genes. (d) Immunostaining for angiogenesis (PECAM1), EMT (VIM) and inflammatory response related gene (CD14). AUC, area under the ROC curve; EMT, epithelial-mesenchymal transition; ROC, receiver operating characteristic.
