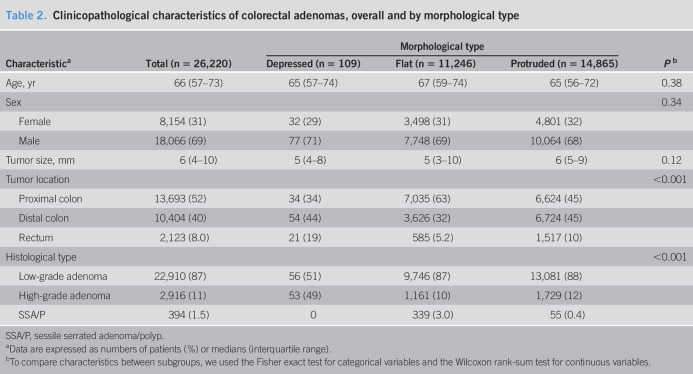
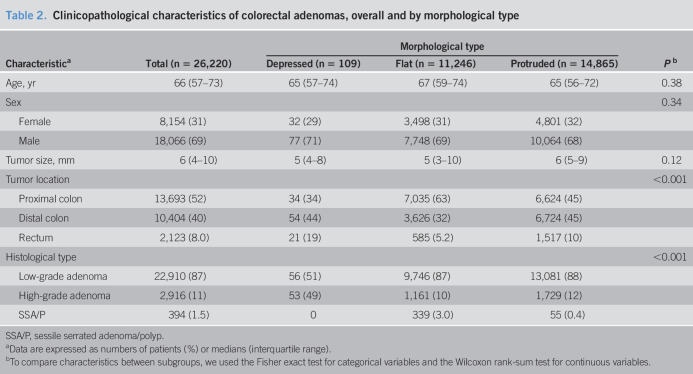
Table 2.
Clinicopathological characteristics of colorectal adenomas, overall and by morphological type
| Characteristica | Total (n = 26,220) | Morphological type | Pb | ||
| Depressed (n = 109) | Flat (n = 11,246) | Protruded (n = 14,865) | |||
| Age, yr | 66 (57–73) | 65 (57–74) | 67 (59–74) | 65 (56–72) | 0.38 |
| Sex | 0.34 | ||||
| Female | 8,154 (31) | 32 (29) | 3,498 (31) | 4,801 (32) | |
| Male | 18,066 (69) | 77 (71) | 7,748 (69) | 10,064 (68) | |
| Tumor size, mm | 6 (4–10) | 5 (4–8) | 5 (3–10) | 6 (5–9) | 0.12 |
| Tumor location | <0.001 | ||||
| Proximal colon | 13,693 (52) | 34 (34) | 7,035 (63) | 6,624 (45) | |
| Distal colon | 10,404 (40) | 54 (44) | 3,626 (32) | 6,724 (45) | |
| Rectum | 2,123 (8.0) | 21 (19) | 585 (5.2) | 1,517 (10) | |
| Histological type | <0.001 | ||||
| Low-grade adenoma | 22,910 (87) | 56 (51) | 9,746 (87) | 13,081 (88) | |
| High-grade adenoma | 2,916 (11) | 53 (49) | 1,161 (10) | 1,729 (12) | |
| SSA/P | 394 (1.5) | 0 | 339 (3.0) | 55 (0.4) | |
SSA/P, sessile serrated adenoma/polyp.
Data are expressed as numbers of patients (%) or medians (interquartile range).
To compare characteristics between subgroups, we used the Fisher exact test for categorical variables and the Wilcoxon rank-sum test for continuous variables.


