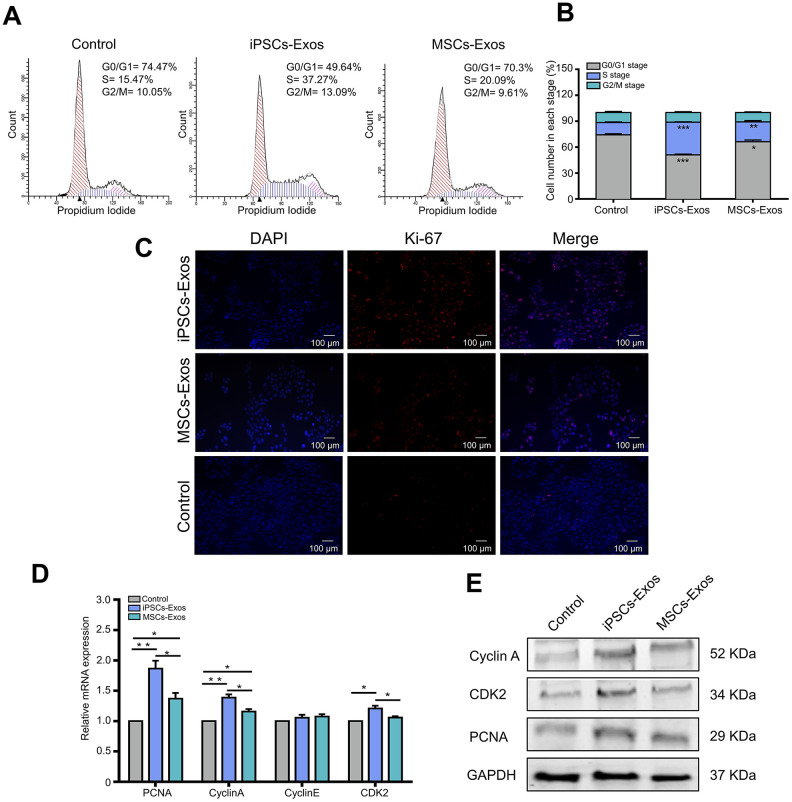
Figure 4.
Effects of iPSCs/MSCs-Exos on the cell cycle. (A)HCECs were treated with iPSCs/MSCs-Exos. Then, after 24 h, the distribution of cell cycle was determined by flow cytometry. (B) The cell number in each stage was quantified and is shown in the bar graphs. iPSCs-Exos significantly increased the number of HCECs in the S phase, which was accompanied by a significant decrease in the number of cells in the G0/G1 phase. (C) After HCECs were stimulated with iPSCs/MSCs-Exos for 48 h, immunofluorescent staining was performed with anti-Ki-67 antibody. The nuclei were stained by DAPI. (D) Quantitative RT-PCR analysis of HCECs showed that PCNA, cyclin A and CDK2 mRNA were upregulated in iPSCs-Exos group compared with MSCs-Exos group and the control. (E) Protein levels of PCNA, cyclin A and CDK2 were measured by western-blot after treatment with iPSCs/MSCs-Exos for 24 h. The data shown here are the mean ± SEM from three independent experiments. * P<0.05, ** P<0.01.

