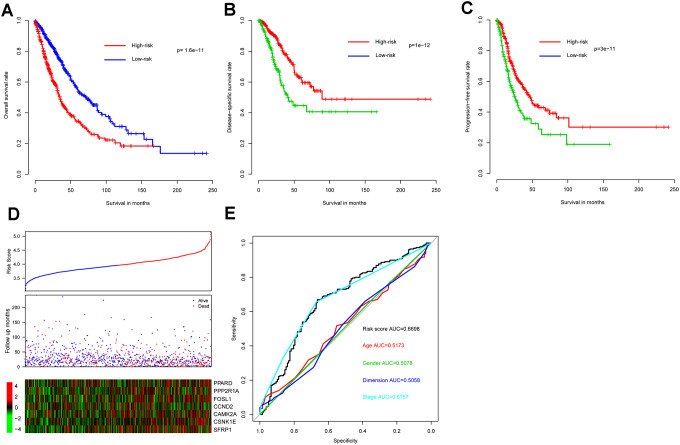
Figure 1.
Model prognostic performance in the training cohort. Overall (A), disease-free (B), and progression-free (C) survival intervals were compared between risk score-predicted high- and low-risk groups. Detailed survival, risk score, and gene expression pattern data are shown (D). The heatmap shows scaled relative gene expression values for each sample. Area under the receiver-operator characteristic (AUROC) curve for clinical indicator- and risk score-based survival prediction is shown (E).

