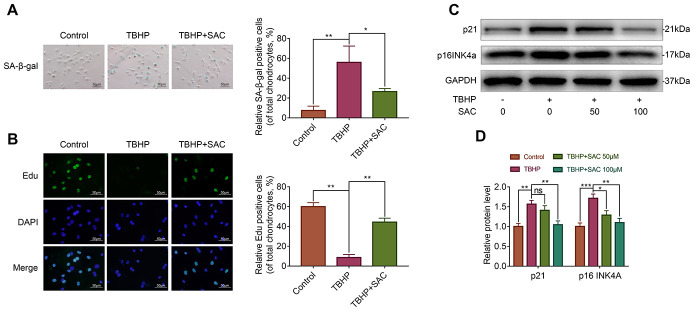
Figure 3.
SAC protects TBHP-treated chondrocytes against senescence. (A) Representative images show the SA-β-gal staining assay results in chondrocytes treated with or without SAC for 24 h and 50 μM TBHP for 2 h. Scale bar: 50 μm. (B) Representative images show the EdU staining assay results in chondrocytes treated with or without SAC for 24 h and 50 μM TBHP for 2 h. Scale bar: 50 μm. (C) Representative western blot images and (D) Histogram plots show p21 and p16INK4a protein levels in chondrocytes treated with or without SAC for 24 h and 50 μM TBHP for 2 h. Note: The data are presented as the means ± SD of three independent experiments. *p < 0.05, **p < 0.01, and ***p < 0.001.

