Figure 5.
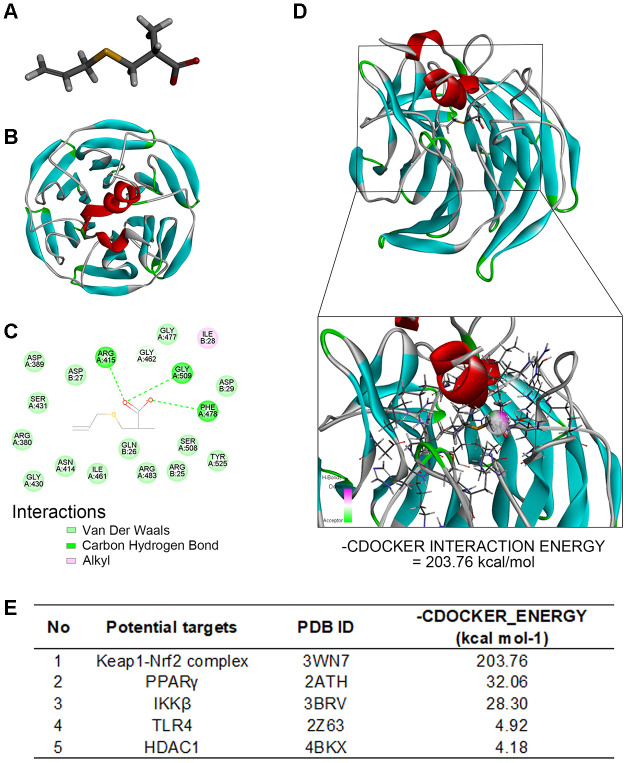
Molecular docking analysis shows SAC interacts with the Keap1-Nrf2 complex. (A) The structure of SAC based on Discovery studio 2016. (B) The ribbon model of the Keap1-Nrf2 complex. (C) The 2-D model shows that Keap1-Nrf2 complex interacts with SAC through four potential active site amino acid residues, ARG415, ARG380, ARG483, and SER508. (D) The 3D docking model shows interactions between SAC and the Keap1-Nrf2 complex. The -CDOCKER interaction energy value for SAC and the Keap1-Nrf2 complex binding interaction was 203.76 kcal/mol. (E) The -CDOCKER interaction energy values for interaction between SAC and potential binding proteins, the Keap1-Nrf2 complex, HDAC1, IKKβ, PPARγ, and TLR4 are shown.

