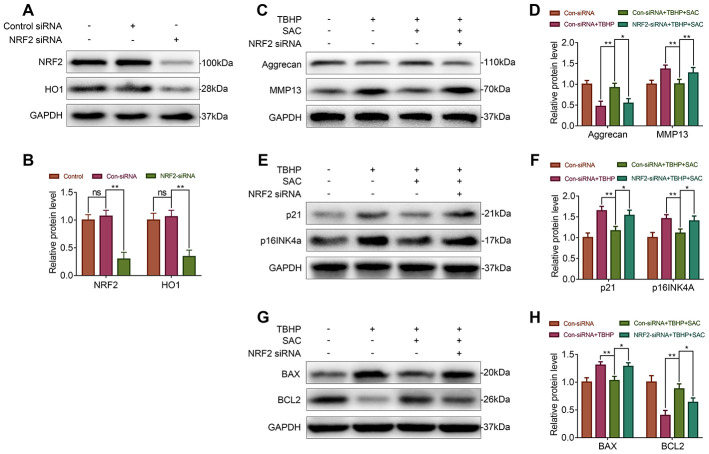
Figure 7.
Nrf2 knockdown abrogates the beneficial effects of SAC. (A, B) Western blot analysis shows Nrf2 and HO1 protein levels in control and Nrf2 knockdown chondrocytes. (C, E, G) Representative western blot images and (D, F, H) Histogram plots show the levels of Aggrecan, MMP13, p21, p16INK4a, BAX, and BCL2 proteins in the control and Nrf2 knockdown chondrocytes treated with or without SAC for 24 h and 50 μM TBHP for 2 h. Note: The data are presented as the means ± SD of three independent experiments. *p < 0.05, **p < 0.01, and ***p < 0.001.

