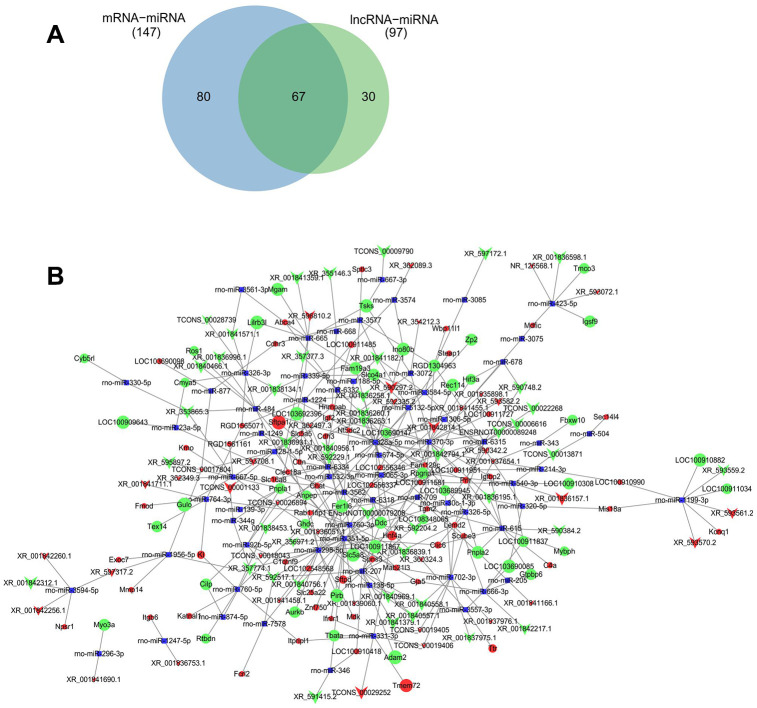
Figure 8.
ceRNAs regulatory network of lncRNA-miRNA-mRNA. Predicted common miRNA regulated by differentially expressed lncRNA and mRNA (A). ceRNAs regulatory network of lncRNA-miRNA-mRNA was constructed with differentially expressed lncRNAs and their predicted binding miRNAs, and differentially expressed mRNA and their predicted binding miRNAs by Cytoscape V3.7.0 software (B). Red and green balls represent the upregulated and downregulated mRNAs, red and green arrows represent the upregulated and downregulated lncRNAs, and small blue squares represent miRNA. The size of balls, arrows and squares represents degree of P values.

