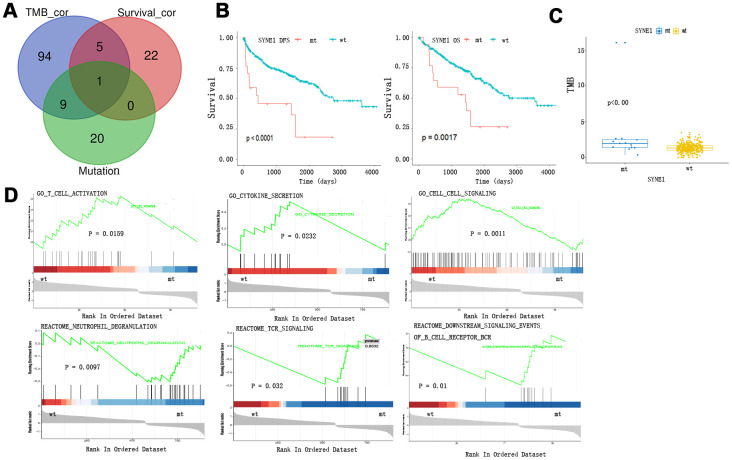
Figure 2.
TMB and survival prognosis based on SYNE1 mutation and enrichment pathway analysis. (A) Venn diagram of frequently mutated genes showing TMB correlated and survival correlated mutated genes. (B) SYNE1 mutation and survival prognosis. (C) SYNE1 mutation is related to a higher TMB. (D) GSEA enrichment based on SYNE1 mutation: wt, wild type; mt, mutant type.

